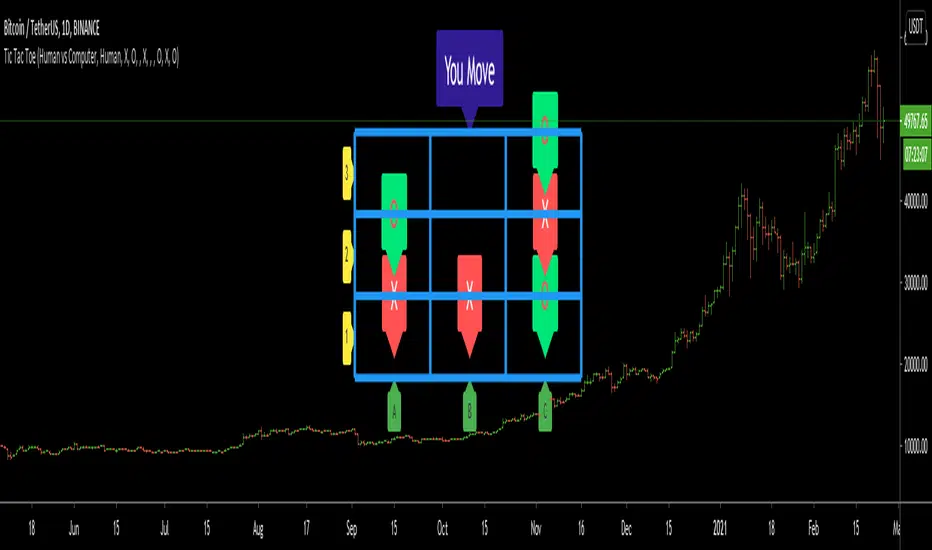
Tic Tac Toe (For Fun)Hello All,
I think all of you know the game "Tic Tac Toe" :) This time I tried to make this game, and also I tried to share an example to develop a game script in Pine. Just for fun ;)
Tic Tac Toe Game Rules:
1. The game is played on a grid that's 3 squares by 3 squares.
2. You are "O", the computer is X. Players take turns putting their marks in empty squares.
3. if a player makes 3 of her marks in a row (up, down, across, or diagonally) the he is the winner.
4. When all 9 squares are full, the game is over (draw)
So, how to play the game?
- The player/you can play "O", meaning your mark is "O", so Xs for the script. please note that: The script plays with ONLY X
- There is naming for all squears, A1, A2, A3, B1, B2, B3, C1, C2, C3. you will see all these squares in the options.
- also You can set who will play first => "Human" or "Computer"
if it's your turn to move then you will see "You Move" text, as seen in the following screenshot. for example you want to put "O" to "A1" then using options set A1 as O
How the script play?
it uses MinMax algorithm with constant depth = 4. And yes we don't have option to make recursive functions in Pine at the moment so I made four functions for each depth. this idea can be used in your scripts if you need such an algorithm. if you have no idea about MinMax algorithm you can find a lot of articles on the net :)
The script plays its move automatically if its turn to play. you will just need to set the option that computer played (A1, C3, etc)
if it's computer turn to play then it calculates and show the move it wants to play like "My Move : B3 <= X" then using options you need to set B3 as X
Also it checks if the board is valid or not:
I have tested it but if you see any bug let me know please
Enjoy!
ابحث في النصوص البرمجية عن "THE SCRIPT"
[Autoview][BackTest]Dual MA Ribbons R0.12 by JustUncleLThis is an implementation of a strategy based on two MA Ribbons, a Fast Ribbon and a Slow Ribbon. This strategy can be used on Normal candlestick charts or Renko charts (if you are familiar with them).
The strategy revolves around a pair of scripts: One to generate alerts signals for Autoview and one for Backtesting, to tune your settings.
The risk management options are performed within the script to set SL(StopLoss), TP(TargetProfit), TSL(Trailing Stop Loss) and TTP (Trailing Target Profit). The only requirement for Autoview is to Buy and Sell as directed by this script, no complicated syntax is required.
The Dual Ribbons are designed to capture the inferred behavior of traders and investors by using two groups of averages:
> Traders MA Ribbon: Lower MA and Upper MA (Aqua=Uptrend, Blue=downtrend, Gray=Neutral), with center line Avg MA (Orange dotted line).
> Investors MAs Ribbon: Lower MA and Upper MA (Green=Uptrend, Red=downtrend, Gray=Neutral), with center line Avg MA (Fuchsia dotted line).
> Anchor time frame (0=current). This is the time frame that the MAs are calculated for. This way 60m MA Ribbons can be viewed on a 15 min chart to establish tighter Stop Loss conditions.
Trade Management options:
Option to specify Backtest start and end time.
Trailing Stop, with Activate Level (as % of price) and Trailing Stop (as % of price)
Target Profit Level, (as % of price)
Stop Loss Level, (as % of price)
BUY green triangles and SELL dark red triangles
Trade Order closed colour coded Label:
>> Dark Red = Stop Loss Hit
>> Green = Target Profit Hit
>> Purple = Trailing Stop Hit
>> Orange = Opposite (Sell) Order Close
Trade Management Indication:
Trailing Stop Activate Price = Blue dotted line
Trailing Stop Price = Fuschia solid stepping line
Target Profit Price = Lime '+' line
Stop Loss Price = Red '+' line
Dealing With Renko Charts:
If you choose to use Renko charts, make sure you have enabled the "IS This a RENKO Chart" option, (I have not so far found a way to Detect the type of chart that is running).
If you want non-repainting Renko charts you MUST use TRADITIONAL Renko Bricks. This type of brick is fixed and will not change size.
Also use Renko bricks with WICKS DISABLED. Wicks are not part of Renko, the whole idea of using Renko bricks is not to see the wick noise.
Set you chart Time Frame to the lowest possible one that will build enough bricks to give a reasonable history, start at 1min TimeFrame. Renko bricks are not dependent on time, they represent a movement in price. But the chart candlestick data is used to create the bricks, so lower TF gives more accurate Brick creation.
You want to size your bricks to 2/1000 of the pair price, so for ETHBTC the price is say 0.0805 then your Renko Brick size should be about 2*0.0805/1000 = 0.0002 (round up).
You may find there is some slippage in value, but this can be accounted for in the Backtest by setting your commission a bit higher, for Binance for example I use 0.2%
Special thanks goes to @CryptoRox for providing the initial Risk management Framework in his "How to automate this strategy for free using a chrome extension" example.

alpha Renko intraday wave timeI was asked to share my experimental Renko intraday wave time. So here it is warts and all. The same for the rest - except the Weis cumulative volume.
Renko wave time is in minutes. This script is strictly intraday and has not been played with extensively.
You must use traditional Renko and set the script wave size to the same size as the Renko brick size.
If you click on the sideways wishbone or "V" in the middle upper part of the chart you will get all of the scripts in this particular sandbox. After clicking the sideways wish bone click on "make it mine". You will then have the whole sandbox. The only published script is the Weis cumulative wave.
The "Boys MAs" is supposed to be a script for daily charts and from within some kind of consolidation. In any case I am intrigued by some signals. You have a variety of sandbox options in the format section of the boys MAs.
These codes are pretty rough with lots of abandoned lines of script.

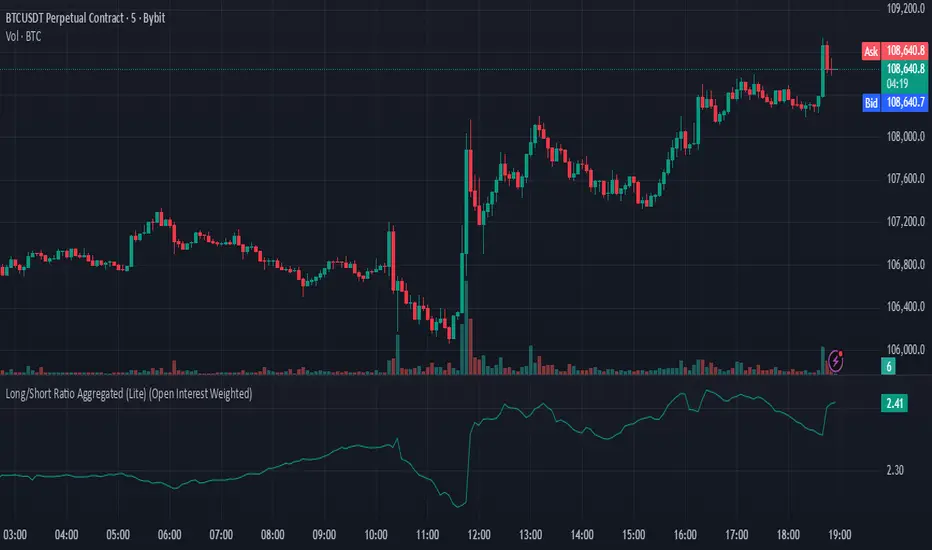
Long/Short Ratio Aggregated (Lite)Description — Long/Short Ratio Aggregated (Lite)
This indicator provides a cross-exchange, open-interest-weighted aggregation of the Long/Short Ratio (LSR) for the cryptocurrency asset currently on your chart. It is designed to unify fragmented derivatives positioning data from multiple major exchanges into a single normalized signal that more accurately reflects real market sentiment and positioning bias across platforms.
Concept and Originality
Traditional Long/Short Ratio indicators are exchange-specific. They show how many traders are long versus short, but only within the scope of one venue (e.g., Binance or Bybit). This makes them incomplete and often misleading for directional bias analysis, since different exchanges host different participant profiles, levels of leverage, and quote-currency exposures.
This script addresses that limitation by:
Aggregating LSR data across multiple exchanges (Binance and Bybit).
Weighting each ratio by Open Interest (OI) — ensuring exchanges with higher open positions contribute proportionally more to the overall sentiment.
Normalizing all contract types (USDT, USDC, and USD-margined) into a consistent base-currency format.
This step corrects for structural differences between coin- and stablecoin-margined instruments, producing a true like-for-like comparison.
The result is a globalized Long/Short Ratio, normalized by exposure and liquidity, suitable for multi-venue orderflow estimation and directional bias assessment.
Note for moderators: I know there are already other scripts out there, but they may not support Open Interest Weighting or the same number of pairs. They also might not support proper normalization like in my script.
Calculation Methodology
For each supported exchange and contract type:
The script retrieves the latest Long/Short Ratio (LSR) and Open Interest (OI) values.
OI is used as the weighting factor, creating a proportional representation of positioning volume.
Values denominated in USD are normalized into base currency using close-price adjustment.
The final value is computed as:
Weighted LSR = (Σ (LSRᵢ × OIᵢ)) / (Σ OIᵢ)
This ensures that if, for example, Binance has twice the open interest of Bybit, its LSR contributes twice as much to the total weighted sentiment.
Interpretation
Value > 1.0 → Market participants are net-long (bullish bias).
Value < 1.0 → Market participants are net-short (bearish bias).
Strength of deviation from 1.0 indicates positioning imbalance magnitude.
Because the ratio is OI-weighted, large players or heavily margined exchanges influence the output proportionally more than smaller, low-volume venues — making this metric a better reflection of true market positioning rather than isolated retail sentiment.
Usage and Applications
Use this indicator as a component in:
Orderflow and sentiment confirmation, alongside price action and volume.
Funding rate correlation studies.
Intraday reversals or exhaustion zones, when combined with volatility or OI delta metrics.
Overlaying or combining this indicator with open interest change, cumulative volume delta, or funding rate divergence allows traders to build a high-resolution understanding of positioning shifts and crowd behavior.
Notes
The “Lite” version is optimized for execution and accessibility, focusing on accuracy while staying within Pine Script’s computational limits.
Exchange data availability may vary by symbol; unsupported pairs automatically return na and are automatically not included in the weighted calculation.
In summary:
This indicator transforms fragmented, exchange-specific Long/Short Ratio into a unified, OI-weighted global sentiment measure — a foundational tool for traders seeking to quantify derivative-side orderflow bias with cross-venue accuracy.
IU Trailing Stop Loss MethodsThe 'IU Trailing Stop Loss Methods' it's a risk management tool which allows users to apply 12 trailing stop-loss (SL) methods for risk management of their trades and gives live alerts when the trailing Stop loss has hit. Below is a detailed explanation of each input and the working of the Script.
Main Inputs:
- bar_time: Specifies the date from which the trade begins and entry price will be the open of the first candle.
- entry_type: Choose between 'Long' or 'Short' positions.
- trailing_method: Select the trailing stop-loss method. Options include ATR, Parabolic SAR, Supertrend, Point/Pip based, Percentage, EMA, Highest/Lowest, Standard Deviation, and multiple target-based methods.
- exit_after_close: If checked, exits the trade only after the candle closes.
Optional Inputs:
ATR Settings:
- atr_Length: Length for the ATR calculation.
- atr_factor: ATR multiplier for SL calculation.
Parabolic SAR Settings:
- start, increment, maximum: Parameters for the Parabolic SAR indicator.
Supertrend Settings:
- supertrend_Length, supertrend_factor: Length and factor for the Supertrend indicator.
Point/Pip Based:
- point_base: Set trailing SL in points/pips.
Percentage Based:
- percentage_base: Set SL as a percentage of entry price.
EMA Settings:
- ema_Length: Length for EMA calculation.
Standard Deviation Settings:
- std_Length, std_factor: Length and factor for standard deviation calculation.
Highest/Lowest Settings:
- highest_lowest_Length: Length for the highest/lowest SL calculation.
Target-Based Inputs:
- ATR, Point, Percentage, and Standard Deviation based target SL settings with customizable lengths and multipliers.
Entry Logic:
- Trades initiate based on the entry_type selected and the specified bar_time.
- If Long is selected, a long trade is initiated when the conditions match, and vice versa for Short.
Trailing Stop-Loss (SL) Methods Explained:
The strategy dynamically adjusts stop-loss based on the chosen method. Each method has its calculation logic:
- ATR: Stop-loss calculated using ATR multiplied by a user-defined factor.
- Parabolic SAR: Uses the Parabolic SAR indicator for trailing stop-loss.
- Supertrend: Utilizes the Supertrend indicator as the stop-loss line.
- Point/Pip Based: Fixed point-based stop-loss.
- Percentage Based: SL set as a percentage of entry price.
- EMA: SL based on the Exponential Moving Average.
- Highest/Lowest: Uses the highest high or lowest low over a specified period.
- Standard Deviation: SL calculated using standard deviation.
Exit Conditions:
- If exit_after_close is enabled, the position will only close after the candle confirms the stop-loss hit.
- If exit_after_close is disabled, the strategy will close the trade immediately when the SL is breached.
Visualization:
The script plots the chosen trailing stop-loss method on the chart for easy visualization.
Target-Based Trailing SL Logic:
- When a position is opened, the strategy calculates the initial stop-loss and progressively adjusts it as the price moves favorably.
- Each SL adjustment is stored in an array for accurate tracking and visualization.
Alerts and Labels:
- When the Entry or trailing stop loss is hit this scripts draws a label and give alert to the user that trailing stop has been hit for the trade.
Note - on the historical data The Script will show nothing if the entry and the exit has happened on the same candle, because we don't know what was hit first SL or TP (basically how the candle was formed on the lower timeframe).
Summary:
This script offers flexible trailing stop-loss options for traders who want dynamic risk management in their strategies. By offering multiple methods like ATR, SAR, Supertrend, and EMA, it caters to various trading styles and risk preferences.

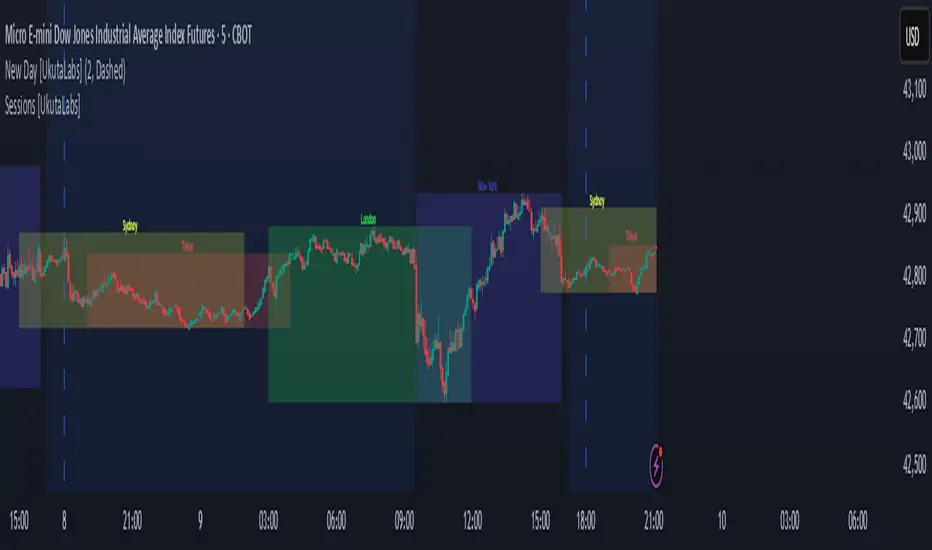
Sessions [UkutaLabs]█ OVERVIEW
Sessions is a trading toolkit that displays the different trading sessions on your chart during a trading day. By default, Sessions displays the four standard trading sessions; New York, Tokyo, London, and Sydney.
Each of the four sessions can be toggled, and the Sessions indicator is completely customizable, allowing users to define their own sessions to be generated by the script.
The aim of this script is to improve the trading experience of users by automatically displaying information about each default or custom session to the user.
█ USAGE
This script will automatically detect and label different market sessions. By default, the script will identify the four standard trading sessions, but each of these can be toggled off in the settings.
However, users are not limited to these four trading sessions and have the ability to define their own sessions to be identified by the script. When a session begins, the script will automatically start outlining the market data of that session, including the high and low of the period that is represented by the session.
If the market is within two or more sessions at the same time, then each session will be treated individually and will overlap with each other.
The sessions will be identified as a colored box surrounding the market data of the period that it represents, and a label will be displayed above the box to identify the session that it represents. The label, color and period of each session is completely customizable.
The user can also adjust all sessions at once to account for timezones in the settings.
█ SETTINGS
Session 1
• Session 1: Determines whether or not this session will be drawn by the script.
• A string field to determine the name of the session that will be displayed above the session range.
• Two time fields representing the start and finish of the session.
• A color field to determine the color of the range and label.
Session 2
• Session 2: Determines whether or not this session will be drawn by the script.
• A string field to determine the name of the session that will be displayed above the session range.
• Two time fields representing the start and finish of the session.
• A color field to determine the color of the range and label.
Session 3
• Session 3: Determines whether or not this session will be drawn by the script.
• A string field to determine the name of the session that will be displayed above the session range.
• Two time fields representing the start and finish of the session.
• A color field to determine the color of the range and label.
Session 4
• Session 4: Determines whether or not this session will be drawn by the script.
• A string field to determine the name of the session that will be displayed above the session range.
• Two time fields representing the start and finish of the session.
• A color field to determine the color of the range and label.
Time Zones
• UTC +/-: Determines the offset of each session. Enter - before the number to represent a negative offset.
chrono_utilsLibrary "chrono_utils"
📝 Description
Collection of objects and common functions that are related to datetime windows session days and time ranges. The main purpose of this library is to handle time-related functionality and make it easy to reason about a future bar checking if it will be part of a predefined session and/or inside a datetime window. All existing session functionality I found in the documentation e.g. "not na(time(timeframe, session, timezone))" are not suitable for strategy scripts, since the execution of the orders is delayed by one bar, due to the script execution happening at the bar close. Moreover, a history operator with a negative value that looks forward is not allowed in any pinescript expression. So, a prediction for the next bar using the bars_back argument of "time()"" and "time_close()" was necessary. Thus, I created this library to overcome this small but very important limitation. In the meantime, I added useful functionality to handle session-based behavior. An interesting utility that emerged from this development is data anomaly detection where a comparison between the prediction and the actual value is happening. If those two values are different then a data inconsistency happens between the prediction bar and the actual bar (probably due to a holiday, half session day, a timezone change etc..)
🤔 How to Guide
To use the functionality this library provides in your script you have to import it first!
Copy the import statement of the latest release by pressing the copy button below and then paste it into your script. Give a short name to this library so you can refer to it later on. The import statement should look like this:
import jason5480/chrono_utils/2 as chr
To check if a future bar will be inside a window first of all you have to initialize a DateTimeWindow object.
A code example is the following:
var dateTimeWindow = chr.DateTimeWindow.new().init(fromDateTime = timestamp('01 Jan 2023 00:00'), toDateTime = timestamp('01 Jan 2024 00:00'))
Then you have to "ask" the dateTimeWindow if the future bar defined by an offset (default is 1 that corresponds th the next bar), will be inside that window:
// Filter bars outside of the datetime window
bool dateFilterApproval = dateTimeWindow.is_bar_included()
You can visualize the result by drawing the background of the bars that are outside the given window:
bgcolor(color = dateFilterApproval ? na : color.new(color.fuchsia, 90), offset = 1, title = 'Datetime Window Filter')
In the same way, you can "ask" the Session if the future bar defined by an offset it will be inside that session.
First of all, you should initialize a Session object.
A code example is the following:
var sess = chr.Session.new().from_sess_string(sess = '0800-1700:23456', refTimezone = 'UTC')
Then check if the given bar defined by the offset (default is 1 that corresponds th the next bar), will be inside the session like that:
// Filter bars outside the sessions
bool sessionFilterApproval = view.sess.is_bar_included()
You can visualize the result by drawing the background of the bars that are outside the given session:
bgcolor(color = sessionFilterApproval ? na : color.new(color.red, 90), offset = 1, title = 'Session Filter')
In case you want to visualize multiple session ranges you can create a SessionView object like that:
var view = SessionView.new().init(SessionDays.new().from_sess_string('2345'), array.from(SessionTimeRange.new().from_sess_string('0800-1600'), SessionTimeRange.new().from_sess_string('1300-2200')), array.from('London', 'New York'), array.from(color.blue, color.orange))
and then call the draw method of the SessionView object like that:
view.draw()
🏋️♂️ Please refer to the "EXAMPLE DATETIME WINDOW FILTER" and "EXAMPLE SESSION FILTER" regions of the script for more advanced code examples of how to utilize the full potential of this library, including user input settings and advanced visualization!
⚠️ Caveats
As I mentioned in the description there are some cases that the prediction of the next bar is not accurate. A wrong prediction will affect the outcome of the filtering. The main reasons this could happen are the following:
Public holidays when the market is closed
Half trading days usually before public holidays
Change in the daylight saving time (DST)
A data anomaly of the chart, where there are missing and/or inconsistent data.
A bug in this library (Please report by PM sending the symbol, timeframe, and settings)
Special thanks to @robbatt and @skinra for the constructive feedback 🏆. Without them, the exposed API of this library would be very lengthy and complicated to use. Thanks to them, now the user of this library will be able to get the most, with only a few lines of code!

Pinescript - Standard Array Functions Library by RRBStandard Array Functions Library by RagingRocketBull 2021
Version 1.0
This script provides a library of every standard Pinescript array function for live testing with all supported array types.
You can find the full list of supported standard array functions below.
There are several libraries:
- Common String Functions Library
- Common Array Functions Library
- Standard Array Functions Library
Features:
- Supports all standard array functions (30+) with all possible array types* (* - except array.new* functions and label, line array types)
- Live Output for all/selected functions based on User Input. Test any function for possible errors you may encounter before using in script.
- Output filters: show errors, hide all excluded and show only allowed functions using a list of function names
- Console customization options: set custom text size, color, page length, line spacing
Notes:
- uses Pinescript v3 Compatibility Framework
- uses Common String Functions Library
- has to be a separate script to reduce the number of local scopes in Common Array Function Library, there's no way to merge these scripts into a single library.
- lets you live test all standard array functions for errors. If you see an error - change params in UI
- array types that are not supported by certain functions and producing a compilation error were disabled with "error" showing up as result
- if you see "Loop too long" error - hide/unhide or reattach the script
- doesn't use pagination, a single str contains all output
- for most array functions to work (except push), an array must be defined with at least 1 pre-existing dummy element 0.
- array.slice and array.fill require from_index < to_index otherwise error
- array.join only supports string arrays, and delimiter must be a const string, can't be var/input. Use join_any_array to join any array type into string. You can also use tostring() to join int, float arrays.
- array.sort only supports int, float arrays. Use sort_any_array from the Common Array Function Library to sort any array type.
- array.sort only sorts values, doesn't preserve indexes. Use sort_any_array from the Common Array Function Library to sort any array while preserving indexes.
- array.concat appends string arrays in reverse order, other array types are appended correctly
- array.covariance requires 2 int, float arrays of the same size
- tostring(flag) works only for internal bool vars, flag expression can't depend on any inputs of any type, use bool_to_str instead
- you can't create an if/function that returns var type value/array - compiler uses strict types and doesn't allow that
- however you can assign array of any type to another array of any type creating an arr pointer of invalid type that must be reassigned to a matching array type before used in any expression to prevent error
- source_array and create_any_array2 use this loophole to return an int_arr pointer of a var type array
- this works for all array types defined with/without var keyword. This doesn't work for string arrays defined with var keyword for some reason
- you can't do this with var type vars, this can be done only with var type arrays because they are pointers passed by reference, while vars are the actual values passed by value.
- wrapper functions solve the problem of returning var array types. This is the only way of doing it when the top level arr type is undefined.
- you can only pass a var type value/array param to a function if all functions inside support every type - otherwise error
- alternatively values of every type must be passed simultaneously and processed separately by corresponding if branches/functions supporting these particular types returning a common single result type
- get_var_types solves this problem by generating a list of dummy values of every possible type including the source type, allowing a single valid branch to execute without error
- examples of functions supporting all array types: array.size, array.get, array.push. Examples of functions with limited type support: array.sort, array.join, array.max, tostring
- unlike var params/global vars, you can modify array params and global arrays directly from inside functions using standard array functions, but you can't use := (it only works for local arrays)
- inside function always work with array.copy to prevent accidental array modification
- you can't compare arrays
- there's no na equivalent for arrays, na(arr) doesn't work
P.S. A wide array of skills calls for an even wider array of responsibilities
List of functions:
- array.avg(arr)
- array.clear(arr)
- array.concat(arr1, arr2)
- array.copy(arr)
- array.covariance(arr1, arr2)
- array.fill(arr, value, index_from, index_to)
- array.get(arr, index)
- array.includes(arr, value)
- array.indexof(arr, value)
- array.insert(arr, index, value)
- array.join(arr, delimiter)
- array.lastindexof(arr, value)
- array.max(arr)
- array.median(arr)
- array.min(arr)
- array.mode(arr)
- array.pop(arr)
- array.push(arr, value)
- array.range(arr)
- array.remove(arr, index)
- array.reverse(arr)
- array.set(arr, index, value)
- array.shift(arr)
- array.size(arr)
- array.slice(arr, index_from, index_to)
- array.sort(arr, order)
- array.standardize()
- array.stdev(arr)
- array.sum(arr)
- array.unshift(arr, value)
- array.variance(arr)

CSPDMost Advanced & Accurate CandleStick Pattern Detector
Looking All Over of All Markets for All Important Powerful Reversal | Corrective Patterns (25 type)
Filtering the Results with Optional Features like Oscillator, Bollinger Bands, Volume Confirmation, Prior and Following Candles Confirmation which are Fully Customizable.
With this you can detect:
Hammer | Shooting star
Inverted Hammer | Hanging
Long legged Doji | Dragonfly Doji | Gravestone Doji
Bullish tweezers | Bearish tweezers
Bullish inside bar | Bearish inside bar
Bullish three line strike | Bearish three line strike
Bullish engulfing | Bearish engulfing
Piercing line | Dark cloud cover
Bullish abandoned baby | Bearish abandoned baby
Morning star | Evening star
Three white soldiers | Three black crows
*Bullish kayo | *Bearish kayo
Features:
Prior and Following candles Confirmation
You can set prior and following candle as basic prerequisites for marking candles as pattern to make sure you are at the top or bottom of the trend.
Volume confirmation
You can active volume increasing confirmation for some of pattern with adjustable increase % relative to prior candle | candles.
Oscillator Confirmation
Active oscillator confirmation. Select your approved oscillator from list (Stochastic, RSI, StochRSI, MFI, StochMFI) then enter desired value for marking candles as bullish | bearish pattern.
Bollinger Bands Confirmation
Active BB confirmation. Configure your Bollinger Bands. Now only see the patterns which reached or crossed from Bands. Also you can enable BB clod to have your BB indicator at the same time.
Adjustable Flexibility and Precision
You can set tolerance% for Osc and BB Confirmation - each one separately - for more control.
Self-adaptability
The properties of markets change over time, for example the amplitude of fluctuations and the intensity of movements. The script is designed in such a way that you can examine the price history as a benchmark for changes in market properties to adopt determinants. Also you can control those manually.
Self-regulatory
The user has the ability to change input factors depending on their point of view.
Behind the pattern recognition algorithms, there are relationships and similarities in their appearance that cause them to be influenced by each other. Simultaneously with changing the determining factors of each pattern by you, script automatically adjusts other details in accordance with your changes.
Alerts
You can set for type of pattern or each one of pattern have been detected.
Fully Costumizable
All of these options can be change and adjust.
Note 1.
The patterns are based on extensive study of reference and famous sources and the experience of me and my friends in trading and analysis with price action methods.
Note 2.
Due to the Pine limitations in the number of outputs | plots for each script, our attempt has been made to select the best and most important patterns.
Note 3.
So far, many scripts have been written in this field, but our experience with all of them and even the build in version was not satisfactory, and this was the initial motivation for making the script.
We strive to improve progress and elimination of shortcomings and we will continue to make this better.
Note 4.
Through personal experience and based on the principles of market and candlestick psychology, we discovered a new type of pattern and named it as Kayo.
kayo is a two candle pattern which formed when:
1.We have a pivot point with prior candles as left bars and following candles as right bar. Pivot candle called as second candle.
2.In a bullish kayo, first candle must closed descending and second candle must closed as ascending. For bearish kayo vise versa.
3.In a bullish kayo, second candle's lower wick must be longer then upper wick.
4. A pattern marked as kayo when its conditions do not correspond to any of the other patterns(include the confirmation that user added), ie it has the last naming priority over the other patterns.
Note 5.
When you active confirmation options for patterns like hammer, engulf and etc which they conditions are like kayo in some extent, if they can't pass the confirmation steps, they can be marked as kayo pattern.
Note 6.
If you active volume confirmation for Three white soldiers | Three black crows, the confirmation get passed if the volume of forth or third candle increased as value as entered relative to volume EMA3 of 3 candles.
Note 7.
In a bullish pattern all highs of following candles MUST be higher than prior highs and all lows of following candles MUST be higher than prior lows. For bearish patterns vise versa.
This type of confirmation depends on High and Low NOT close!
Gift to price action lovers!
Support us with your like and comments. let us know your experience, points and idea to make this better together.

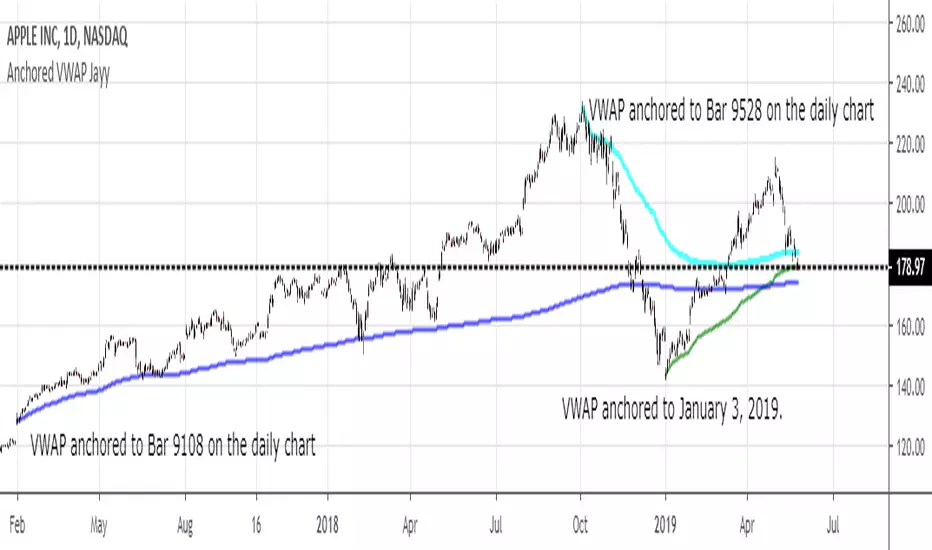
MIDAS VWAP Jayy his is just a bash together of two MIDAS VWAP scripts particularly AkifTokuz and drshoe.
I added the ability to show more MIDAS curves from the same script.
The algorithm primarily uses the "n" number but the date can be used for the 8th VWAP
I have not converted the script to version 3.
To find bar number go into "Chart Properties" select " "background" then select Indicator Titles and "Indicator values". When you place your cursor over a bar the first number you see adjacent to the script title is the bar number. Put that in the dialogue box midline is MIDAS VWAP . The resistance is a MIDAS VWAP using bar highs. The resistance is MIDAS VWAP using bar lows.
In most case using N will suffice. However, if you are flipping around charts inputting a specific date can be handy. In this way, you can compare the same point in time across multiple instruments eg first trading day of the year or an election date.
Adding dates into the dialogue box is a bit cumbersome so in this version, it is enabled for only one curve. I have called it VWAP and it follows the typical VWAP algorithm. (Does that make a difference? Read below re my opinion on the Difference between MIDAS VWAP and VWAP ).
I have added the ability to start from the bottom or top of the initiating bar.
In theory in a probable uptrend pick a low of a bar for a low pivot and start the MIDAS VWAP there using the support.
For a downtrend use the high pivot bar and select resistance. The way to see is to play with these values.
Difference between MIDAS VWAP and the regular VWAP
MIDAS itself as described by Levine uses a time anchored On-Balance Volume (OBV) plotted on a graph where the horizontal (abscissa) arm of the graph is cumulative volume not time. He called his VWAP curves Support/Resistance VWAP or S/R curves. These S/R curves are often referred to as "MIDAS curves".
These are the main components of the MIDAS chart. A third algorithm called the Top-Bottom Finder was also described. (Separate script).
Additional tools have been described in "MIDAS_Technical_Analysis"
Midas Technical Analysis: A VWAP Approach to Trading and Investing in Today’s Markets by Andrew Coles, David G. Hawkins
Copyright © 2011 by Andrew Coles and David G. Hawkins.
Denoting the different way in which Levine approached the calculation.
The difference between "MIDAS" VWAP and VWAP is, in my opinion, much ado about nothing. The algorithms generate identical curves albeit the MIDAS algorithm launches the curve one bar later than the VWAP algorithm which can be a pain in the neck. All of the algorithms that I looked at on Tradingview step back one bar in time to initiate the MIDAS curve. As such the plotted curves are identical to traditional VWAP assuming the initiation is from the candle/bar midpoint.
How did Levine intend the curves to be drawn?
On a reversal, he suggested the initiation of the Support and Resistance VVWAP (S/R curve) to be started after a reversal.
It is clear in his examples this happens occasionally but in many cases he initiates the so-called MIDAS S/R VWAP right at the reversal point. In any case, the algorithm is problematic if you wish to start a curve on the first bar of an IPO .
You will get nothing. That is a pain. Also in Levine's writings, he describes simply clicking on the point where a
S/R VWAP is to be drawn from. As such, the generally accepted method of initiating the curve at N-1 is a practical and sensible method. The only issue is that you cannot draw the curve from the first bar on any security, as mentioned without resorting to the typical VWAP algorithm. There is another difference. VWAP is launched from the middle of the bar (as per AlphaTrends), You can also launch from the top of the bar or the bottom (or anywhere for that matter). The calculation proceeds using the top or bottom for each new bar.
The potential applications are discussed in the MIDAS Technical Analysis book.
Open Interest Bubbles [BackQuant]Open Interest Bubbles
A visual OI positioning overlay that aggregates futures open interest across major venues, normalizes it into a consistent “signal strength” scale, then plots extreme events as bubbles, labels, and optional horizontal levels directly on price.
What this is for
Open interest is one of the cleanest ways to track when positioning is building, unwinding, or aggressively shifting. The problem is raw OI is noisy, exchange-specific, and hard to compare across time. This script solves that by:
- Aggregating OI across multiple exchanges.
- Letting you choose what “OI signal” you care about (raw, delta, percent versions).
- Normalizing the signal so “big events” are easy to spot.
- Plotting those events as bubbles and levels at the exact price they occurred.
You end up with a clean, fast visual map of where large positioning changes occurred, and where those events may later matter as reaction points.
────────────────────────────────────────────────────────────
Plotting types (what you can display)
Bubbles
This mode plots OI events as size-bucketed circles on the chart. Bigger bubbles represent stronger normalized events. You can tune:
- Bubble sizing by bucket (Tiny → Huge).
- Heatmap vs solid color styling.
- Signed vs unsigned coloring (positive/negative separation or magnitude-only).
Best use:
- Spotting “where something changed” at a glance.
- Identifying clusters of positioning events around key price zones.
- Seeing whether the market is repeatedly building/closing positions at similar levels.
Levels
Levels mode draws a horizontal line at the anchor price when an extreme OI event triggers. These act like “positioning memory” levels:
- They do not claim to be support/resistance by themselves.
- They highlight prices where the derivatives market clearly did something meaningful.
Best use:
- Marking potential reaction zones.
- Combining with your price action tools (structure, OBs, FVGs) to confirm whether an OI level aligns with a technical level.
- Building a “map” of where leverage likely entered or exited.
Modes available in the script:
- Off
- Bubbles
- Bubbles + Labels
- Labels Only
- Levels + Labels
────────────────────────────────────────────────────────────
Aggregated Open Interest source (multi-exchange)
This indicator builds a single aggregated OI series by requesting OI data from multiple exchanges and summing it. You can toggle exchanges on/off:
- Binance, Bybit, OKX, Bitget, Kraken, HTX, Deribit
You can also choose OI units:
- COIN , OI in base units (native sizing)
- USD , converted for a dollar-value representation
Important note:
Not every symbol has OI data on every venue. If the script cannot build an aggregated series for the symbol, it will throw an error rather than quietly plotting garbage.
────────────────────────────────────────────────────────────
OI Source, what the bubbles are measuring
You control what “signal” is normalized and plotted:
- Delta , change in aggregated OI from the prior bar.
Use when you want to highlight bursts of new positioning or sudden unwind events.
- Raw OI , the aggregated open interest level itself.
Use when you want to highlight absolute positioning build-up periods.
- Delta % , percent change in OI.
Use when you want moves normalized to the current OI regime, useful across different market eras.
- Raw OI % , percent change form of the raw series.
Use when you want relative changes rather than absolute size.
Practical guidance:
- Delta modes are best for “event detection”.
- Raw modes are better for “regime context” and whether positioning is structurally rising or fading.
────────────────────────────────────────────────────────────
Normalization (the key to making it readable)
Because OI varies massively across assets and time, the script includes multiple normalization modes to convert your chosen OI source into a comparable “strength” value.
Options:
- ZScore , deviation from a rolling mean in standard deviation units.
- StdNorm , scaled by rolling standard deviation.
- AbsZScore , absolute value version for magnitude-only mapping.
- AbsStdNorm , absolute value version for magnitude-only mapping.
- None , plots raw values (advanced users only, often too noisy visually).
Why this matters:
Normalization makes a “1.5” or “3.0” threshold mean something across different assets and timeframes, instead of being stuck to raw OI units.
────────────────────────────────────────────────────────────
Threshold system (when bubbles/levels trigger)
The plot is driven by two user thresholds:
- Base Threshold
Controls where “meaningful” events start. Raising this reduces noise and focuses on larger deviations.
- Extreme Threshold
Controls what qualifies as a top-tier event. Extreme events are what you typically want to convert into labels and levels.
You also control side filtering:
- Both , show positive and negative events.
- Positive Only , show only increases (or positive signal side depending on source).
- Negative Only , show only decreases (or negative signal side).
In practice:
- Use Base Threshold to tune chart cleanliness.
- Use Extreme Threshold to mark only the “big stuff” that tends to matter later.
────────────────────────────────────────────────────────────
Anchor Source (where the bubble/level is placed)
The indicator places bubbles, labels, and levels at a price anchor you choose:
- HL2, Close, Open, High, Low, VWAP
This is important because “where you pin the event” changes how it reads:
- Close is clean and consistent for backtesting and candle-close logic.
- High/Low can better represent where the fight occurred intrabar.
- VWAP can be useful for “fair price” anchoring in active markets.
────────────────────────────────────────────────────────────
Style system (theme, palette, signed logic)
This script is built to look good and stay readable on busy charts.
Themes
- BackQuant, Classic, Ice, Fire, Mono, Custom
Palette Mode
- Solid , one consistent color
- Heatmap , intensity increases with magnitude
- Single Color Adaptive , adapts to chart background for clarity
Side Coloring
- Signed , positive and negative events can use different ramps
- Unsigned , magnitude-only coloring
Negative theme handling:
- Auto (mirrors your chosen theme),
- Invert (flips the ramp),
- Custom (fully user-defined negative palette).
What this gives you:
- You can run a clean “mono” look for professional charts.
- Or a high-contrast heatmap for fast scanning.
- Or fully custom branding colors for BackQuant-style presentation.
────────────────────────────────────────────────────────────
Labels (what’s inside the label)
When labels are enabled, the script can display:
- OI , the aggregated OI value
- OI + Norm , OI plus normalized strength
- Norm Only , just the normalized strength
- Src + Norm , the selected source value (Delta, Raw, %) plus normalized strength
You can also control:
- Left/Center/Right label alignment
- Number formatting style (Raw, Compact, Volume format)
Best practice:
- Use “Src + Norm” when you want both the raw event size and its rarity.
- Use “Norm Only” when you want a clean, minimal chart.
────────────────────────────────────────────────────────────
Levels and object limits (performance and cleanliness)
Because this script draws objects, it includes a hard cleanup system:
- You set Max Levels / Labels to control chart clutter.
- The script deletes older lines/labels when the limit is exceeded.
This is critical if you trade lower timeframes, where OI events can trigger frequently.
────────────────────────────────────────────────────────────
How to interpret the signals
What a large bubble usually means:
- A statistically large positioning change relative to recent history.
- This can represent fresh leverage entering, forced liquidations, or aggressive de-risking, depending on direction and context.
How to use levels:
- Treat them as “attention levels”, not automatic entries.
- Combine them with structure and liquidity tools:
- If price revisits an OI level and shows rejection, it often confirms that level mattered.
- If price slices through with no reaction, it often indicates the OI event was transitional, not defended.
Common setups:
- Clustered extreme bubbles near a breakout zone, then retest later.
- Extreme negative event at capitulation low, followed by structure flip.
- Extreme positive build into resistance, then unwind and mean reversion.
Also, please check out @NoveltyTrade for the OI Aggregation logic & pulling the data source!
Here is the original script:

ULTIMATE ORDER FLOW SYSTEM🔥 ULTIMATE ORDER FLOW SYSTEM
Overview
This comprehensive order flow analysis tool combines **Volume Profile**, **Cumulative Delta**, and **Large Order Detection** to identify high-probability trading setups. The script analyzes institutional order flow patterns and volume distribution to pinpoint key levels where price is likely to react.
📊 Core Components & Methodology
🔥 ULTIMATE ORDER FLOW SYSTEM
Overview
This comprehensive order flow analysis tool combines Volume Profile, Cumulative Delta, and Large Order Detection to identify high-probability trading setups. The script analyzes institutional order flow patterns and volume distribution to pinpoint key levels where price is likely to react.
________________________________________
📊 Core Components & Methodology
1. Volume Profile Analysis
The script constructs a horizontal volume profile by:
• Dividing the price range into configurable rows (default: 20)
• Accumulating volume at each price level over a lookback period (default: 50 bars)
• Separating buy volume (green bars close > open) from sell volume (red bars)
• Identifying three critical levels:
o POC (Point of Control): Price level with highest traded volume - acts as a strong magnet
o VAH/VAL (Value Area High/Low): Contains 70% of total volume - defines fair value zone
o HVN (High Volume Nodes): Resistance zones where institutions accumulated positions
o LVN (Low Volume Nodes): Thin zones that price moves through quickly - ideal targets
Why This Matters: Institutional traders leave footprints through volume. HVN zones show where large players defended levels, making them reliable support/resistance.
________________________________________
2. Cumulative Delta (Order Flow)
Tracks the running total of buying vs selling pressure:
• Bar Delta: Difference between buy and sell volume per candle
• Cumulative Delta: Sum of all bar deltas - shows net directional pressure
• Delta Moving Average: Smoothed delta (20-period) to identify trend
• Delta Divergences:
o Bullish: Price makes lower low, but delta makes higher low (absorption at bottom)
o Bearish: Price makes higher high, but delta makes lower high (exhaustion at top)
How It Works: When cumulative delta trends up while price consolidates, it signals accumulation. Delta divergences reveal when smart money is positioned opposite to retail expectations.
________________________________________
3. Large Order Detection
Identifies institutional-sized orders in real-time:
• Compares current bar volume to 20-period moving average
• Flags orders exceeding 2.5x average volume (configurable multiplier)
• Distinguishes bullish (green circles below) vs bearish (red circles above) large orders
Rationale: Sudden volume spikes at key levels indicate institutional participation - the "fuel" needed for breakouts or reversals.
________________________________________
🎯 Trading Signal Logic
Combined Setup Criteria
The script generates SHORT and LONG signals when multiple conditions align:
SHORT Signal Requirements:
1. Price reaches an HVN resistance zone (within 0.2%)
2. Large sell order detected (volume spike + red candle)
3. Cumulative delta is bearish OR bearish divergence present
4. 10-bar cooldown between signals (prevents overtrading)
LONG Signal Requirements:
1. Price reaches an HVN support zone
2. Large buy order detected (volume spike + green candle)
3. Cumulative delta is bullish OR bullish divergence present
4. 10-bar cooldown enforced
________________________________________
🔧 Customization Options
Setting - Purpose - Recommendation
Volume Profile Rows - Granularity of level detection - 20 (balanced)
Lookback Period - Historical data analyzed - 50 bars (intraday), 200 (swing)
Large Order Multiplier - Sensitivity to volume spikes - 2.5x (standard), 3.5x (conservative)
HVN Threshold - Resistance zone detection - 1.3 (default)
LVN Threshold - Target zone identification - 0.6 (default)
Divergence Lookback - Pivot detection period - 5 bars (responsive)
________________________________________
📈 Dashboard Indicators
The real-time panel displays:
• POC: Current Point of Control price
• Location: Whether price is at HVN resistance
• Orders: Current large buy/sell activity
• Cumulative Δ: Net order flow value + trend direction
• Divergence: Active bullish/bearish divergences
• Bar Strength: % of candle volume that's directional (>65% = strong)
• SETUP: Current trade signal (LONG/SHORT/WAIT)
________________________________________
🎨 Visual System
• Yellow POC Line: Highest volume level - primary pivot
• Blue Value Area Box: Fair value zone (VAH to VAL)
• Red HVN Zones: Resistance/support from institutional accumulation
• Green LVN Zones: Low-liquidity targets for quick moves
• Volume Bars: Green (buy pressure) vs Red (sell pressure) distribution
• Triangles: LONG (green up) and SHORT (red down) entry signals
• Diamonds: Divergence warnings (cyan=bullish, fuchsia=bearish)
________________________________________
💡 How This Script Is Unique
Unlike standalone volume profile or delta indicators, this script:
1. Synthesizes three complementary methods - volume structure, order flow momentum, and liquidity detection
2. Requires multi-factor confirmation - signals only trigger when price, volume, and delta align at key zones
3. Adapts to market regime - delta filters ensure you're trading with the dominant order flow direction
4. Provides context, not just signals - the dashboard helps you understand why a setup is forming
________________________________________
⚙️ Best Practices
Timeframes:
• 5-15 min: Scalping (use 30-50 bar lookback)
• 1-4 hour: Swing trading (use 100-200 bar lookback)
Risk Management:
• Enter on signal candle close
• Stop loss: Beyond nearest HVN/LVN zone
• Target 1: Next LVN level
• Target 2: Opposite value area boundary
Filters:
• Avoid signals during major news events
• Require bar delta strength >65% for aggressive entries
• Wait for delta MA cross confirmation in ranging markets
________________________________________
🚨 Alerts Available
• Long Setup Trigger
• Short Setup Trigger
• Bullish/Bearish Divergence Detection
• Large Buy/Sell Order Execution
________________________________________
📚 Educational Context
This methodology is based on principles used by professional order flow traders:
• Market Profile Theory: Volume distribution reveals fair value
• Tape Reading: Large orders show institutional intent
• Auction Theory: Price seeks areas of liquidity imbalance (LVN zones)
The script automates pattern recognition that discretionary traders spend years learning to identify manually.
________________________________________
⚠️ Disclaimer
This indicator is a trading tool, not a trading system. It identifies high-probability setups based on order flow analysis but requires proper risk management, market context, and trader discretion. Past performance does not guarantee future results.
________________________________________
Version: 6 (Pine Script)
Type: Overlay + Separate Pane (Delta Panel)
Resource Usage: Moderate (500 bars history, 500 lines/boxes)
________________________________________
For questions or support, please comment below. If you find this script valuable, please boost and favorite! 🚀
1. Volume Profile Analysis
The script constructs a horizontal volume profile by:
- Dividing the price range into configurable rows (default: 20)
- Accumulating volume at each price level over a lookback period (default: 50 bars)
- Separating buy volume (green bars close > open) from sell volume (red bars)
- Identifying three critical levels:
- POC (Point of Control): Price level with highest traded volume - acts as a strong magnet
- VAH/VAL (Value Area High/Low): Contains 70% of total volume - defines fair value zone
- HVN (High Volume Nodes): Resistance zones where institutions accumulated positions
- LVN (Low Volume Nodes): Thin zones that price moves through quickly - ideal targets
Why This Matters: Institutional traders leave footprints through volume. HVN zones show where large players defended levels, making them reliable support/resistance.
---
2. Cumulative Delta (Order Flow)
Tracks the running total of buying vs selling pressure:
- **Bar Delta**: Difference between buy and sell volume per candle
- **Cumulative Delta**: Sum of all bar deltas - shows net directional pressure
- **Delta Moving Average**: Smoothed delta (20-period) to identify trend
- **Delta Divergences**:
- **Bullish**: Price makes lower low, but delta makes higher low (absorption at bottom)
- **Bearish**: Price makes higher high, but delta makes lower high (exhaustion at top)
**How It Works**: When cumulative delta trends up while price consolidates, it signals accumulation. Delta divergences reveal when smart money is positioned opposite to retail expectations.
---
### 3. **Large Order Detection**
Identifies **institutional-sized orders** in real-time:
- Compares current bar volume to 20-period moving average
- Flags orders exceeding 2.5x average volume (configurable multiplier)
- Distinguishes bullish (green circles below) vs bearish (red circles above) large orders
**Rationale**: Sudden volume spikes at key levels indicate institutional participation - the "fuel" needed for breakouts or reversals.
---
## 🎯 Trading Signal Logic
### Combined Setup Criteria
The script generates **SHORT** and **LONG** signals when multiple conditions align:
**SHORT Signal Requirements:**
1. Price reaches an HVN resistance zone (within 0.2%)
2. Large sell order detected (volume spike + red candle)
3. Cumulative delta is bearish OR bearish divergence present
4. 10-bar cooldown between signals (prevents overtrading)
**LONG Signal Requirements:**
1. Price reaches an HVN support zone
2. Large buy order detected (volume spike + green candle)
3. Cumulative delta is bullish OR bullish divergence present
4. 10-bar cooldown enforced
---
## 🔧 Customization Options
| Setting | Purpose | Recommendation |
|---------|---------|----------------|
| **Volume Profile Rows** | Granularity of level detection | 20 (balanced) |
| **Lookback Period** | Historical data analyzed | 50 bars (intraday), 200 (swing) |
| **Large Order Multiplier** | Sensitivity to volume spikes | 2.5x (standard), 3.5x (conservative) |
| **HVN Threshold** | Resistance zone detection | 1.3 (default) |
| **LVN Threshold** | Target zone identification | 0.6 (default) |
| **Divergence Lookback** | Pivot detection period | 5 bars (responsive) |
---
## 📈 Dashboard Indicators
The real-time panel displays:
- **POC**: Current Point of Control price
- **Location**: Whether price is at HVN resistance
- **Orders**: Current large buy/sell activity
- **Cumulative Δ**: Net order flow value + trend direction
- **Divergence**: Active bullish/bearish divergences
- **Bar Strength**: % of candle volume that's directional (>65% = strong)
- **SETUP**: Current trade signal (LONG/SHORT/WAIT)
---
## 🎨 Visual System
- **Yellow POC Line**: Highest volume level - primary pivot
- **Blue Value Area Box**: Fair value zone (VAH to VAL)
- **Red HVN Zones**: Resistance/support from institutional accumulation
- **Green LVN Zones**: Low-liquidity targets for quick moves
- **Volume Bars**: Green (buy pressure) vs Red (sell pressure) distribution
- **Triangles**: LONG (green up) and SHORT (red down) entry signals
- **Diamonds**: Divergence warnings (cyan=bullish, fuchsia=bearish)
---
## 💡 How This Script Is Unique
Unlike standalone volume profile or delta indicators, this script:
1. **Synthesizes three complementary methods** - volume structure, order flow momentum, and liquidity detection
2. **Requires multi-factor confirmation** - signals only trigger when price, volume, and delta align at key zones
3. **Adapts to market regime** - delta filters ensure you're trading with the dominant order flow direction
4. **Provides context, not just signals** - the dashboard helps you understand *why* a setup is forming
---
## ⚙️ Best Practices
**Timeframes:**
- 5-15 min: Scalping (use 30-50 bar lookback)
- 1-4 hour: Swing trading (use 100-200 bar lookback)
**Risk Management:**
- Enter on signal candle close
- Stop loss: Beyond nearest HVN/LVN zone
- Target 1: Next LVN level
- Target 2: Opposite value area boundary
**Filters:**
- Avoid signals during major news events
- Require bar delta strength >65% for aggressive entries
- Wait for delta MA cross confirmation in ranging markets
---
## 🚨 Alerts Available
- Long Setup Trigger
- Short Setup Trigger
- Bullish/Bearish Divergence Detection
- Large Buy/Sell Order Execution
---
## 📚 Educational Context
This methodology is based on principles used by professional order flow traders:
- **Market Profile Theory**: Volume distribution reveals fair value
- **Tape Reading**: Large orders show institutional intent
- **Auction Theory**: Price seeks areas of liquidity imbalance (LVN zones)
The script automates pattern recognition that discretionary traders spend years learning to identify manually.
---
## ⚠️ Disclaimer
This indicator is a **trading tool, not a trading system**. It identifies high-probability setups based on order flow analysis but requires proper risk management, market context, and trader discretion. Past performance does not guarantee future results.
---
**Version**: 6 (Pine Script)
**Type**: Overlay + Separate Pane (Delta Panel)
**Resource Usage**: Moderate (500 bars history, 500 lines/boxes)
---
*For questions or support, please comment below. If you find this script valuable, please boost and favorite!* 🚀

Mars Signals - Ultimate Institutional Suite v3.0(Joker)Comprehensive Trading Manual
Mars Signals – Ultimate Institutional Suite v3.0 (Joker)
## Chapter 1 – Philosophy & System Architecture
This script is not a simple “buy/sell” indicator.
Mars Signals – UIS v3.0 (Joker) is designed as an institutional-style analytical assistant that layers several methodologies into a single, coherent framework.
The system is built on four core pillars:
1. Smart Money Concepts (SMC)
- Detection of Order Blocks (professional demand/supply zones).
- Detection of Fair Value Gaps (FVGs) (price imbalances).
2. Smart DCA Strategy
- Combination of RSI and Bollinger Bands
- Identifies statistically discounted zones for scaling into spot positions or exiting shorts.
3. Volume Profile (Visible Range Simulation)
- Distribution of volume by price, not by time.
- Identification of POC (Point of Control) and high-/low-volume areas.
4. Wyckoff Helper – Spring
- Detection of bear traps, liquidity grabs, and sharp bullish reversals.
All four pillars feed into a Confluence Engine (Scoring System).
The final output is presented in the Dashboard, with a clear, human-readable signal:
- STRONG LONG 🚀
- WEAK LONG ↗
- NEUTRAL / WAIT
- WEAK SHORT ↘
- STRONG SHORT 🩸
This allows the trader to see *how many* and *which* layers of the system support a bullish or bearish bias at any given time.
## Chapter 2 – Settings Overview
### 2.1 General & Dashboard Group
- Show Dashboard Panel (`show_dash`)
Turns the dashboard table in the corner of the chart ON/OFF.
- Show Signal Recommendation (`show_rec`)
- If enabled, the textual signal (STRONG LONG, WEAK SHORT, etc.) is displayed.
- If disabled, you only see feature status (ON/OFF) and the current price.
- Dashboard Position (`dash_pos`)
Determines where the dashboard appears on the chart:
- `Top Right`
- `Bottom Right`
- `Top Left`
### 2.2 Smart Money (SMC) Group
- Enable SMC Strategy (`show_smc`)
Globally enables or disables the Order Block and FVG logic.
- Order Block Pivot Lookback (`ob_period`)
Main parameter for detecting key pivot highs/lows (swing points).
- Default value: 5
- Concept:
A bar is considered a pivot low if its low is lower than the lows of the previous 5 and the next 5 bars.
Similarly, a pivot high has a high higher than the previous 5 and the next 5 bars.
These pivots are used as anchors for Order Blocks.
- Increasing `ob_period`:
- Fewer levels.
- But levels tend to be more significant and reliable.
- In highly volatile markets (major news, war events, FOMC, etc.),
using values 7–10 is recommended to filter out weak levels.
- Show Fair Value Gaps (`show_fvg`)
Enables/disables the drawing of FVG zones (imbalances).
- Bullish OB Color (`c_ob_bull`)
- Color of Bullish Order Blocks (Demand Zones).
- Default: semi-transparent green (transparency ≈ 80).
- Bearish OB Color (`c_ob_bear`)
- Color of Bearish Order Blocks (Supply Zones).
- Default: semi-transparent red.
- Bullish FVG Color (`c_fvg_bull`)
- Color of Bullish FVG (upward imbalance), typically yellow.
- Bearish FVG Color (`c_fvg_bear`)
- Color of Bearish FVG (downward imbalance), typically purple.
### 2.3 Smart DCA Strategy Group
- Enable DCA Zones (`show_dca`)
Enables the Smart DCA logic and visual labels.
- RSI Length (`rsi_len`)
Lookback period for RSI (default: 14).
- Shorter → more sensitive, more noise.
- Longer → fewer signals, higher reliability.
- Bollinger Bands Length (`bb_len`)
Moving average period for Bollinger Bands (default: 20).
- BB Multiplier (`bb_mult`)
Standard deviation multiplier for Bollinger Bands (default: 2.0).
- For extremely volatile markets, values like 2.5–3.0 can be used so that only extreme deviations trigger a DCA signal.
### 2.4 Volume Profile (Visible Range Sim) Group
- Show Volume Profile (`show_vp`)
Enables the simulated Volume Profile bars on the right side of the chart.
- Volume Lookback Bars (`vp_lookback`)
Number of bars used to compute the Volume Profile (default: 150).
- Higher values → broader historical context, heavier computation.
- Row Count (`vp_rows`)
Number of vertical price segments (rows) to divide the total price range into (default: 30).
- Width (%) (`vp_width`)
Relative width of each volume bar as a percentage.
In the code, bar widths are scaled relative to the row with the maximum volume.
> Technical note: Volume Profile calculations are executed only on the last bar (`barstate.islast`) to keep the script performant even on higher timeframes.
### 2.5 Wyckoff Helper Group
- Show Wyckoff Events (`show_wyc`)
Enables detection and plotting of Wyckoff Spring events.
- Volume MA Length (`vol_ma_len`)
Length of the moving average on volume.
A bar is considered to have Ultra Volume if its volume is more than 2× the volume MA.
## Chapter 3 – Smart Money Strategy (Order Blocks & FVG)
### 3.1 What Is an Order Block?
An Order Block (OB) represents the footprint of large institutional orders:
- Bullish Order Block (Demand Zone)
The last selling region (bearish candle/cluster) before a strong upward move.
- Bearish Order Block (Supply Zone)
The last buying region (bullish candle/cluster) before a strong downward move.
Institutions and large players place heavy orders in these regions. Typical price behavior:
- Price moves away from the zone.
- Later returns to the same zone to fill unfilled orders.
- Then continues the larger trend.
In the script:
- If `pl` (pivot low) forms → a Bullish OB is created.
- If `ph` (pivot high) forms → a Bearish OB is created.
The box is drawn:
- From `bar_index ` to `bar_index`.
- Between `low ` and `high `.
- `extend=extend.right` extends the OB into the future, so it acts as a dynamic support/resistance zone.
- Only the last 4 OB boxes are kept to avoid clutter.
### 3.2 Order Block Color Guide
- Semi-transparent Green (`c_ob_bull`)
- Represents a Bullish Order Block (Demand Zone).
- Interpretation: a price region with a high probability of bullish reaction.
- Semi-transparent Red (`c_ob_bear`)
- Represents a Bearish Order Block (Supply Zone).
- Interpretation: a price region with a high probability of bearish reaction.
Overlap (Multiple OBs in the Same Area)
When two or more Order Blocks overlap:
- The shared area appears visually denser/stronger.
- This suggests higher order density.
- Such zones can be treated as high-priority levels for entries, exits, and stop-loss placement.
### 3.3 Demand/Supply Logic in the Scoring Engine
is_in_demand = low <= ta.lowest(low, 20)
is_in_supply = high >= ta.highest(high, 20)
- If current price is near the lowest lows of the last 20 bars, it is considered in a Demand Zone → positive impact on score.
- If current price is near the highest highs of the last 20 bars, it is considered in a Supply Zone → negative impact on score.
This logic complements Order Blocks and helps the Dashboard distinguish whether:
- Market is currently in a statistically cheap (long-friendly) area, or
- In a statistically expensive (short-friendly) area.
### 3.4 Fair Value Gaps (FVG)
#### Concept
When the market moves aggressively:
- Some price levels are skipped and never traded.
- A gap between wicks/shadows of consecutive candles appears.
- These regions are called Fair Value Gaps (FVGs) or Imbalances.
The market generally “dislikes” imbalance and often:
- Returns to these zones in the future.
- Fills the gap (rebalance).
- Then resumes its dominant direction.
#### Implementation in the Code
Bullish FVG (Yellow)
fvg_bull_cond = show_smc and show_fvg and low > high and close > high
if fvg_bull_cond
box.new(bar_index , high , bar_index, low, ...)
Core condition:
`low > high ` → the current low is above the high of two bars ago; the space between them is an untraded gap.
Bearish FVG (Purple)
fvg_bear_cond = show_smc and show_fvg and high < low and close < low
if fvg_bear_cond
box.new(bar_index , low , bar_index, high, ...)
Core condition:
`high < low ` → the current high is below the low of two bars ago; again a price gap exists.
#### FVG Color Guide
- Transparent Yellow (`c_fvg_bull`) – Bullish FVG
Often acts like a magnet for price:
- Price tends to retrace into this zone,
- Fill the imbalance,
- And then continue higher.
- Transparent Purple (`c_fvg_bear`) – Bearish FVG
Price tends to:
- Retrace upward into the purple area,
- Fill the imbalance,
- And then resume downward movement.
#### Trading with FVGs
- FVGs are *not* standalone entry signals.
They are best used as:
- Targets (take-profit zones), or
- Reaction areas where you expect a pause or reversal.
Examples:
- If you are long, a bearish FVG above is often an excellent take-profit zone.
- If you are short, a bullish FVG below is often a good cover/exit zone.
### 3.5 Core SMC Trading Templates
#### Reversal Long
1. Price trades down into a green Order Block (Demand Zone).
2. A bullish confirmation candle (Close > Open) forms inside or just above the OB.
3. If this zone is close to or aligned with a bullish FVG (yellow), the signal is reinforced.
4. Entry:
- At the close of the confirmation candle, or
- Using a limit order near the upper boundary of the OB.
5. Stop-loss:
- Slightly below the OB.
- If the OB is broken decisively and price consolidates below it, the zone loses validity.
6. Targets:
- The next FVG,
- Or the next red Order Block (Supply Zone) above.
#### Reversal Short
The mirror scenario:
- Price rallies into a red Order Block (Supply).
- A bearish confirmation candle forms (Close < Open).
- FVG/premium structure above can act as a confluence.
- Stop-loss goes above the OB.
- Targets: lower FVGs or subsequent green OBs below.
## Chapter 4 – Smart DCA Strategy (RSI + Bollinger Bands)
### 4.1 Smart DCA Concept
- Classic DCA = buying at fixed time intervals regardless of price.
- Smart DCA = scaling in only when:
- Price is statistically cheaper than usual, and
- The market is in a clear oversold condition.
Code logic:
rsi_val = ta.rsi(close, rsi_len)
= ta.bb(close, bb_len, bb_mult)
dca_buy = show_dca and rsi_val < 30 and close < bb_lower
dca_sell = show_dca and rsi_val > 70 and close > bb_upper
Conditions:
- DCA Buy – Smart Scale-In Zone
- RSI < 30 → oversold.
- Close < lower Bollinger Band → price has broken below its typical volatility envelope.
- DCA Sell – Overbought/Distribution Zone
- RSI > 70 → overbought.
- Close > upper Bollinger Band → price is extended far above the mean.
### 4.2 Visual Representation on the Chart
- Green “DCA” Label Below Candle
- Shape: `labelup`.
- Color: lime background, white text.
- Meaning: statistically attractive level for laddered spot entries or short exits.
- Red “SELL” Label Above Candle
- Warning that the market is in an extended, overbought condition.
- Suitable for profit-taking on longs or considering short entries (with proper confluence and risk management).
- Light Green Background (`bgcolor`)
- When `dca_buy` is true, the candle background turns very light green (high transparency).
- This helps visually identify DCA Zones across the chart at a glance.
### 4.3 Practical Use in Trading
#### Spot Trading
Used to build a better average entry price:
- Every time a DCA label appears, allocate a fixed portion of capital (e.g., 2–5%).
- Combining DCA signals with:
- Green OBs (Demand Zones), and/or
- The Volume Profile POC
makes the zone structurally more important.
#### Futures Trading
- Longs
- Use DCA Buy signals as low-risk zones for opening or adding to longs when:
- Price is inside a green OB, or
- The Dashboard already leans LONG.
- Shorts
- Use DCA Sell signals as:
- Exit zones for longs, or
- Areas to initiate shorts with stops above structural highs.
## Chapter 5 – Volume Profile (Visible Range Simulation)
### 5.1 Concept
Traditional volume (histogram under the chart) shows volume over time.
Volume Profile shows volume by price level:
- At which prices has the highest trading activity occurred?
- Where did buyers and sellers agree the most (High Volume Nodes – HVNs)?
- Where did price move quickly due to low participation (Low Volume Nodes – LVNs)?
### 5.2 Implementation in the Script
Executed only when `show_vp` is enabled and on the last bar:
1. The last `vp_lookback` bars (default 150) are processed.
2. The minimum low and maximum high over this window define the price range.
3. This price range is divided into `vp_rows` segments (e.g., 30 rows).
4. For each row:
- All bars are scanned.
- If the mid-price `(high + low ) / 2` falls inside a row, that bar’s volume is added to the row total.
5. The row with the greatest volume is stored as `max_vol_idx` (the POC row).
6. For each row, a volume box is drawn on the right side of the chart.
### 5.3 Color Scheme
- Semi-transparent Orange
- The row with the maximum volume – the Point of Control (POC).
- Represents the strongest support/resistance level from a volume perspective.
- Semi-transparent Blue
- Other volume rows.
- The taller the bar → the higher the volume → the stronger the interest at that price band.
### 5.4 Trading Applications
- If price is above POC and retraces back into it:
→ POC often acts as support, suitable for long setups.
- If price is below POC and rallies into it:
→ POC often acts as resistance, suitable for short setups or profit-taking.
HVNs (Tall Blue Bars)
- Represent areas of equilibrium where the market has spent time and traded heavily.
- Price tends to consolidate here before choosing a direction.
LVNs (Short or Nearly Empty Bars)
- Represent low participation zones.
- Price often moves quickly through these areas – useful for targeting fast moves.
## Chapter 6 – Wyckoff Helper – Spring
### 6.1 Spring Concept
In the Wyckoff framework:
- A Spring is a false break of support.
- The market briefly trades below a well-defined support level, triggers stop losses,
then sharply reverses upward as institutional buyers absorb liquidity.
This movement:
- Clears out weak hands (retail sellers).
- Provides large players with liquidity to enter long positions.
- Often initiates a new uptrend.
### 6.2 Code Logic
Conditions for a Spring:
1. The current low is lower than the lowest low of the previous 50 bars
→ apparent break of a long-standing support.
2. The bar closes bullish (Close > Open)
→ the breakdown was rejected.
3. Volume is significantly elevated:
→ `volume > 2 × volume_MA` (Ultra Volume).
When all conditions are met and `show_wyc` is enabled:
- A pink diamond is plotted below the bar,
- With the label “Spring” – one of the strongest long signals in this system.
### 6.3 Trading Use
- After a valid Spring, markets frequently enter a meaningful bullish phase.
- The highest quality setups occur when:
- The Spring forms inside a green Order Block, and
- Near or on the Volume Profile POC.
Entries:
- At the close of the Spring bar, or
- On the first pullback into the mid-range of the Spring candle.
Stop-loss:
- Slightly below the Spring’s lowest point (wick low plus a small buffer).
## Chapter 7 – Confluence Engine & Dashboard
### 7.1 Scoring Logic
For each bar, the script:
1. Resets `score` to 0.
2. Adjusts the score based on different signals.
SMC Contribution
if show_smc
if is_in_demand
score += 1
if is_in_supply
score -= 1
- Being in Demand → `+1`
- Being in Supply → `-1`
DCA Contribution
if show_dca
if dca_buy
score += 2
if dca_sell
score -= 2
- DCA Buy → `+2` (strong, statistically driven long signal)
- DCA Sell → `-2`
Wyckoff Spring Contribution
if show_wyc
if wyc_spring
score += 2
- Spring → `+2` (entry of strong money)
### 7.2 Mapping Score to Dashboard Signal
- score ≥ 2 → STRONG LONG 🚀
Multiple bullish conditions aligned.
- score = 1 → WEAK LONG ↗
Some bullish bias, but only one layer clearly positive.
- score = 0 → NEUTRAL / WAIT
Rough balance between buying and selling forces; staying flat is usually preferable.
- score = -1 → WEAK SHORT ↘
Mild bearish bias, suited for cautious or short-term plays.
- score ≤ -2 → STRONG SHORT 🩸
Convergence of several bearish signals.
### 7.3 Dashboard Structure
The dashboard is a two-column table:
- Row 0
- Column 0: `"Mars Signals"` – black background, white text.
- Column 1: `"UIS v3.0"` – black background, yellow text.
- Row 1
- Column 0: `"Price:"` (light grey background).
- Column 1: current closing price (`close`) with a semi-transparent blue background.
- Row 2
- Column 0: `"SMC:"`
- Column 1:
- `"ON"` (green) if `show_smc = true`
- `"OFF"` (grey) otherwise.
- Row 3
- Column 0: `"DCA:"`
- Column 1:
- `"ON"` (green) if `show_dca = true`
- `"OFF"` (grey) otherwise.
- Row 4
- Column 0: `"Signal:"`
- Column 1: signal text (`status_txt`) with background color `status_col`
(green, red, teal, maroon, etc.)
- If `show_rec = false`, these cells are cleared.
## Chapter 8 – Visual Legend (Colors, Shapes & Actions)
For quick reading inside TradingView, the visual elements are described line by line instead of a table.
Chart Element: Green Box
Color / Shape: Transparent green rectangle
Core Meaning: Bullish Order Block (Demand Zone)
Suggested Trader Response: Look for longs, Smart DCA adds, closing or reducing shorts.
Chart Element: Red Box
Color / Shape: Transparent red rectangle
Core Meaning: Bearish Order Block (Supply Zone)
Suggested Trader Response: Look for shorts, or take profit on existing longs.
Chart Element: Yellow Area
Color / Shape: Transparent yellow zone
Core Meaning: Bullish FVG / upside imbalance
Suggested Trader Response: Short take-profit zone or expected rebalance area.
Chart Element: Purple Area
Color / Shape: Transparent purple zone
Core Meaning: Bearish FVG / downside imbalance
Suggested Trader Response: Long take-profit zone or temporary supply region.
Chart Element: Green "DCA" Label
Color / Shape: Green label with white text, plotted below the candle
Core Meaning: Smart ladder-in buy zone, DCA buy opportunity
Suggested Trader Response: Spot DCA entry, partial short exit.
Chart Element: Red "SELL" Label
Color / Shape: Red label with white text, plotted above the candle
Core Meaning: Overbought / distribution zone
Suggested Trader Response: Take profit on longs, consider initiating shorts.
Chart Element: Light Green Background (bgcolor)
Color / Shape: Very transparent light-green background behind bars
Core Meaning: Active DCA Buy zone
Suggested Trader Response: Treat as a discount zone on the chart.
Chart Element: Orange Bar on Right
Color / Shape: Transparent orange horizontal bar in the volume profile
Core Meaning: POC – price with highest traded volume
Suggested Trader Response: Strong support or resistance; key reference level.
Chart Element: Blue Bars on Right
Color / Shape: Transparent blue horizontal bars in the volume profile
Core Meaning: Other volume levels, showing high-volume and low-volume nodes
Suggested Trader Response: Use to identify balance zones (HVN) and fast-move corridors (LVN).
Chart Element: Pink "Spring" Diamond
Color / Shape: Pink diamond with white text below the candle
Core Meaning: Wyckoff Spring – liquidity grab and potential major bullish reversal
Suggested Trader Response: One of the strongest long signals in the suite; look for high-quality long setups with tight risk.
Chart Element: STRONG LONG in Dashboard
Color / Shape: Green background, white text in the Signal row
Core Meaning: Multiple bullish layers in confluence
Suggested Trader Response: Consider initiating or increasing longs with strict risk management.
Chart Element: STRONG SHORT in Dashboard
Color / Shape: Red background, white text in the Signal row
Core Meaning: Multiple bearish layers in confluence
Suggested Trader Response: Consider initiating or increasing shorts with a logical, well-placed stop.
## Chapter 9 – Timeframe-Based Trading Playbook
### 9.1 Timeframe Selection
- Scalping
- Timeframes: 1M, 5M, 15M
- Objective: fast intraday moves (minutes to a few hours).
- Recommendation: focus on SMC + Wyckoff.
Smart DCA on very low timeframes may introduce excessive noise.
- Day Trading
- Timeframes: 15M, 1H, 4H
- Provides a good balance between signal quality and frequency.
- Recommendation: use the full stack – SMC + DCA + Volume Profile + Wyckoff + Dashboard.
- Swing Trading & Position Investing
- Timeframes: Daily, Weekly
- Emphasis on Smart DCA + Volume Profile.
- SMC and Wyckoff are used mainly to fine-tune swing entries within larger trends.
### 9.2 Scenario A – Scalping Long
Example: 5-Minute Chart
1. Price is declining into a green OB (Bullish Demand).
2. A candle with a long lower wick and bullish close (Pin Bar / Rejection) forms inside the OB.
3. A Spring diamond appears below the same candle → very strong confluence.
4. The Dashboard shows at least WEAK LONG ↗, ideally STRONG LONG 🚀.
5. Entry:
- On the close of the confirmation candle, or
- On the first pullback into the mid-range of that candle.
6. Stop-loss:
- Slightly below the OB.
7. Targets:
- Nearby bearish FVG above, and/or
- The next red OB.
### 9.3 Scenario B – Day-Trading Short
Recommended Timeframes: 1H or 4H
1. The market completes a strong impulsive move upward.
2. Price enters a red Order Block (Supply).
3. In the same zone, a purple FVG appears or remains unfilled.
4. On a lower timeframe (e.g., 15M), RSI enters overbought territory and a DCA Sell signal appears.
5. The main timeframe Dashboard (1H) shows WEAK SHORT ↘ or STRONG SHORT 🩸.
Trade Plan
- Open a short near the upper boundary of the red OB.
- Place the stop above the OB or above the last swing high.
- Targets:
- A yellow FVG lower on the chart, and/or
- The next green OB (Demand) below.
### 9.4 Scenario C – Swing / Investment with Smart DCA
Timeframes: Daily / Weekly
1. On the daily or weekly chart, each time a green “DCA” label appears:
- Allocate a fixed fraction of your capital (e.g., 3–5%) to that asset.
2. Check whether this DCA zone aligns with the orange POC of the Volume Profile:
- If yes → the quality of the entry zone is significantly higher.
3. If the DCA signal sits inside a daily green OB, the probability of a medium-term bottom increases.
4. Always build the position laddered, never all-in at a single price.
Exits for investors:
- Near weekly red OBs or large purple FVG zones.
- Ideally via partial profit-taking rather than closing 100% at once.
### 9.5 Case Study 1 – BTCUSDT (15-Minute)
- Context: Price has sold off down towards 65,000 USD.
- A green OB had previously formed at that level.
- Near the lower boundary of this OB, a partially filled yellow FVG is present.
- As price returns to this region, a Spring appears.
- The Dashboard shifts from NEUTRAL / WAIT to WEAK LONG ↗.
Plan
- Enter a long near the OB low.
- Place stop below the Spring low.
- First target: a purple FVG around 66,200.
- Second (optional) target: the first red OB above that level.
### 9.6 Case Study 2 – Meme Coin (PEPE – 4H)
- After a strong pump, price enters a corrective phase.
- On the 4H chart, RSI drops below 30; price breaks below the lower Bollinger Band → a DCA label prints.
- The Volume Profile shows the POC at approximately the same level.
- The Dashboard displays STRONG LONG 🚀.
Plan
- Execute laddered buys in the combined DCA + POC zone.
- Place a protective stop below the last significant swing low.
- Target: an expected 20–30% upside move towards the next red OB or purple FVG.
## Chapter 10 – Risk Management, Psychology & Advanced Tuning
### 10.1 Risk Management
No signal, regardless of its strength, replaces risk control.
Recommendations:
- In futures, do not expose more than 1–3% of account equity to risk per trade.
- Adjust leverage to the volatility of the instrument (lower leverage for highly volatile altcoins).
- Place stop-losses in zones where the idea is clearly invalidated:
- Below/above the relevant Order Block or Spring, not randomly in the middle of the structure.
### 10.2 Market-Specific Parameter Tuning
- Calmer Markets (e.g., major FX pairs)
- `ob_period`: 3–5.
- `bb_mult`: 2.0 is usually sufficient.
- Highly Volatile Markets (Crypto, news-driven assets)
- `ob_period`: 7–10 to highlight only the most robust OBs.
- `bb_mult`: 2.5–3.0 so that only extreme deviations trigger DCA.
- `vol_ma_len`: increase (e.g., to ~30) so that Spring triggers only on truly exceptional
volume spikes.
### 10.3 Trading Psychology
- STRONG LONG 🚀 does not mean “risk-free”.
It means the probability of a successful long, given the model’s logic, is higher than average.
- Treat Mars Signals as a confirmation and context system, not a full replacement for your own decision-making.
- Example of disciplined thinking:
- The Dashboard prints STRONG LONG,
- But price is simultaneously testing a multi-month macro resistance or a major negative news event is imminent,
- In such cases, trade smaller, widen stops appropriately, or skip the trade.
## Chapter 11 – Technical Notes & FAQ
### 11.1 Does the Script Repaint?
- Order Blocks and Springs are based on completed pivot structures and confirmed candles.
- Until a pivot is confirmed, an OB does not exist; after confirmation, behavior is stable under classic SMC assumptions.
- The script is designed to be structurally consistent rather than repainting signals arbitrarily.
### 11.2 Computational Load of Volume Profile
- On the last bar, the script processes up to `vp_lookback` bars × `vp_rows` rows.
- On very low timeframes with heavy zooming, this can become demanding.
- If you experience performance issues:
- Reduce `vp_lookback` or `vp_rows`, or
- Temporarily disable Volume Profile (`show_vp = false`).
### 11.3 Multi-Timeframe Behavior
- This version of the script is not internally multi-timeframe.
All logic (OB, DCA, Spring, Volume Profile) is computed on the active timeframe only.
- Practical workflow:
- Analyze overall structure and key zones on higher timeframes (4H / Daily).
- Use lower timeframes (15M / 1H) with the same tool for timing entries and exits.
## Conclusion
Mars Signals – Ultimate Institutional Suite v3.0 (Joker) is a multi-layer trading framework that unifies:
- Price structure (Order Blocks & FVG),
- Statistical behavior (Smart DCA via RSI + Bollinger),
- Volume distribution by price (Volume Profile with POC, HVN, LVN),
- Liquidity events (Wyckoff Spring),
into a single, coherent system driven by a transparent Confluence Scoring Engine.
The final output is presented in clear, actionable language:
> STRONG LONG / WEAK LONG / NEUTRAL / WEAK SHORT / STRONG SHORT
The system is designed to support professional decision-making, not to replace it.
Used together with strict risk management and disciplined execution,
Mars Signals – UIS v3.0 (Joker) can serve as a central reference manual and operational guide
for your trading workflow, from scalping to swing and investment positioning.

Gann Astronomical Turning PointsThis is a comprehensive Pine Script that implements W.D. Gann's astronomical theories to identify potential market turning points. Here's a detailed breakdown of the script:
Overview
The script identifies and displays astronomical events (sun angles, moon phases, and Mercury retrogrades) that Gann theorists believe correlate with market turning points. It also analyzes historical price performance following these events to provide statistical significance.
Key Components
1. Input Parameters
Date Range: Users can set the analysis period (start and end dates)
Display Options: Toggle visibility of different astronomical events and tables
Analysis Settings: Configure the lookback period for price change analysis (1-20 days)
2. Astronomical Calculations
The script includes several functions to calculate celestial positions:
getDaysSinceEpoch(t): Calculates days since January 1, 2000 (reference point)
getSunLongitude(t): Computes the Sun's position in the ecliptic (0-360°)
getMoonPhase(t): Determines the Moon's phase angle relative to the Sun
getMercuryLongitude(t): Calculates Mercury's position in the ecliptic
3. Gann Critical Angles (Sun Events)
The script identifies when the Sun reaches four critical angles that Gann considered significant:
0° Aries (Spring Equinox)
90° Cancer (Summer Solstice)
180° Libra (Fall Equinox)
270° Capricorn (Winter Solstice)
These are detected by tracking when the Sun's longitude crosses these specific angles.
4. Moon Phases
Four key moon phases are identified:
New Moon: Moon passes between Earth and Sun
First Quarter: Moon is 90° east of Sun
Full Moon: Moon is opposite the Sun
Last Quarter: Moon is 270° east of Sun
5. Mercury Retrograde Periods
The script detects when Mercury appears to move backward in its orbit:
Identifies start and end dates of retrograde motion
Displays these periods as highlighted zones on the chart
6. Price Change Analysis
For each astronomical event, the script:
Calculates the percentage price change over a user-defined lookback period
Categorizes changes as positive or negative
Stores this data for statistical analysis
7. Statistical Significance
The script calculates several metrics for each event type:
Average Price Change: Mean percentage change following events
Up/Down Ratio: Number of positive vs. negative changes
Accuracy Percentage: How often the dominant direction occurred
8. Visual Elements
The script includes multiple display components:
Event Labels
Sun Angles: Orange sun symbols displayed above price bars
Moon Phases: Moon phase emojis displayed below price bars
Mercury Retrograde: Red boxes highlighting the retrograde periods
Information Tables
Events Table: Shows upcoming and recent astronomical events
Significance Analysis Table: Displays statistical performance of each event type
Forecast Section: Identifies the next upcoming event and predicted direction
9. Forecasting Functionality
The script predicts market direction for the next astronomical event based on:
Historical average price change for that event type
Statistical accuracy of previous similar events
Color-coded forecast (green for bullish, red for bearish)
This script offers an interesting implementation of Gann's astronomical theories, but should be used as part of a broader analysis rather than as a standalone trading system.
Disclaimer: This indicator is for educational purposes only. Past performance does not guarantee future results. Always conduct your own research and risk assessment before trading.

CNagda-MomentumX - Institutional FlowMomentumX is designed to empower traders with a deeper understanding of market movements by focusing on Institutional Flow and advanced market structure analytics. The core goal is to identify and visualize where major market participants are operating, and to translate these complex footprints into clear, actionable trading signals — all in real time.
Real-time institutional activity mapping
Actionable entry and exit signals based on live market structure
Intuitive dashboard and dynamic chart visuals
Fully customizable modules for trend, liquidity, and order blocks
Core Logic Design
At the heart of MomentumX lies a robust algorithmic engine built to capture and surface institutional trading behavior. By leveraging advanced mathematical models, the indicator calculates institutional volume ratios and price momentum to pinpoint aggressive moves from large participants.
Institutional Volume & Price Momentum:
Utilizes custom volume indicators and price change analysis to detect strong buying or selling pressure, filtering out retail noise.
Liquidity Grab Detection & Activity Zones:
The script identifies liquidity grabs by monitoring abrupt price sweeps at major support/resistance levels—often where institutions trigger stop hunts or reversals. All critical activity zones are automatically color-coded on the chart for instant recognition.
Dashboard Visualization:
A fully dynamic dashboard table overlays live scores for accumulation, distribution, strength, and weakness—giving traders a real-time scan of market health.
Trendline & Order Block Architecture:
The logic auto-detects pivot highs/lows to draw smart trendlines, while the order block system highlights key reversal areas and breaker zones—making market structure clear and actionable.
MomentumX is packed with high-performance modules, each engineered to simplify complex market behavior and enhance decision-making for traders:
Institutional Flow Signals:
Instantly identifies spots where institutional players drive momentum, using unique volume and price activity analytics.
Bullish/Bearish Liquidity Grab Detection:
Marks abrupt price moves that signal stop hunts or reversals, letting traders anticipate snap-backs or trend shifts.
Trendline Auto-Detection:
Smartly draws trendlines based on significant swing highs and lows, automatically adjusting as price evolves.
Order Block System (Rejection/Breaker):
Spots and highlights key reversal zones with order block rectangles, confirming rejections or breakouts at strategic levels.
Dashboard and Bar Coloring:
A clean dashboard overlay presents live market scores, while dynamic bar coloring makes trend, strength, and high-activity periods instantly visible.
User Input Toggles for Each Module:
Every major feature is fully customizable—enable or disable modules to match individual trading setups or preferences.
Scripting/Development
MomentumX’s scripting process is modular, enabling clarity, scalability, and fast optimization throughout development:
Initialization & Inputs:
Start by defining all user input options, module toggles, color settings, and calculation parameters—ensuring maximum flexibility early on.
Core Calculation Functions:
Script advanced institutional volume and price momentum algorithms. Build out swing length logic, market state filters, and activity scoring methods.
Detection Engines:
Develop and integrate engines for liquidity grabs, automated trendline detection, and order block identification—each with dedicated functions for speed and precision.
Visual Overlays & Plotting:
Implement powerful plotting logic for colored bars, score dashboards, trendlines, reversal zones, and liquidity markers—making every data point clear and actionable on the chart.
Testing Handlers:
Add diagnostic panels and debug outputs to refine calculations and assure accuracy in every market environment.
Sample Trade Setups (Usage)
Cnagda MomentumX delivers clarity for multiple trading styles by providing timely, actionable setups grounded in institutional behavior and market structure. Here’s how traders can leverage the indicator for confident decision-making:
Liquidity Grab Reversal
Enter trades around detected liquidity grabs when price sweeps major support/resistance and the dashboard signals a momentum shift.
Example: Wait for a bullish/Bearish grab near market lows/high, with institutional flow turning positive/negative—enter long/short for potential mean reversion.
Order Block Breakout
Trade breakouts when price cleanly rejects or flips key order block zones highlighted on the chart.
Example: Short at a marked breaker block after a rejection signal, confirmed by a downward institutional activity spike.
Trendline Continuation
Ride established market moves by entering on trendline confirmations plotted by the auto-detect system.
Example: Go long after a trendline retest, confirmed by a green bar color and dashboard strength score.
Dashboard Confirmation
Combine dashboard metrics (strength, accumulation, distribution) with bar color overlays for multi-factor entries.
Example: Enter trades only when all market signals align in real time for maximum probability.
For Short Entry check -- Weakness : For Long Entry Check - Strength With Other Indications
MomentumX is not just another indicator – it’s your edge for reading the market like an insider. By transparently mapping institutional flow, uncovering hidden liquidity zones, and color-coding every major structure shift, MomentumX transforms complexity into actionable clarity. Whether you’re scalping, swing trading, or investing, you’ll gain a decisive, real-time advantage on every chart.
Embrace smarter decisions, adapt to changing market conditions instantly, and join a new generation of technically empowered traders.
Customize, observe, and let the market reveal opportunities in a way you’ve never experienced before.
Happy Trading

weighted support or resistance linesQ: Why should users choose this script?
A: I found that in all the publicly available scripts about support and resistance lines, there is basically no weight identification for these lines. In other words, users do not know which support or resistance lines are the most important. So I specifically wrote this script.
1. By adjusting the weights, only the most effective support or resistance lines are displayed. (Length threshold of trend price (Bar))
2. By selecting the number of K-lines, only the latest number of support or resistance lines generated will be displayed. (Maximum number of reserved S/R lines)
3. By selecting whether to automatically remove lines, only support or resistance lines that have not been penetrated by the k-line will be displayed. If this function is checked, the weight can be adjusted lower, as high-weight SR may have already been penetrated, and the newly generated SR may have a lower weight. (Automatically remove lines penetrated by closing price confirmation)
4. Notes: The default parameters work well in 15-minute candlestick charts. For candlestick charts with other time periods, the parameters can be adjusted appropriately. It is suitable for sideways trading but not for strong trends.
5. I'm quite satisfied with the performance of the script, as I specifically optimized it, lol

Forex Heatmap█ OVERVIEW
This indicator creates a dynamic grid display of currency pair cross rates (exchange rates) and percentage changes, emulating the Cross Rates and Heat Map widgets available on our Forex page. It provides a view of realtime exchange rates for all possible pairs derived from a user-specified list of currencies, allowing users to monitor the relative performance of several currencies directly on a TradingView chart.
█ CONCEPTS
Foreign exchange
The Foreign Exchange (Forex/FX) market is the largest, most liquid financial market globally, with an average daily trading volume of over 5 trillion USD. Open 24 hours a day, five days a week, it operates through a decentralized network of financial hubs in various major cities worldwide. In this market, participants trade currencies in pairs , where the listed price of a currency pair represents the exchange rate from a given base currency to a specific quote currency . For example, the "EURUSD" pair's price represents the amount of USD (quote currency) that equals one unit of EUR (base currency). Globally, the most traded currencies include the U.S. dollar (USD), Euro (EUR), Japanese yen (JPY), British pound (GBP), and Australian dollar (AUD), with USD involved in over 87% of all trades.
Understanding the Forex market is essential for traders and investors, even those who do not trade currency pairs directly, because exchange rates profoundly affect global markets. For instance, fluctuations in the value of USD can impact the demand for U.S. exports or the earnings of companies that handle multinational transactions, either of which can affect the prices of stocks, indices, and commodities. Additionally, since many factors influence exchange rates, including economic policies and interest rate changes, analyzing the exchange rates across currencies can provide insight into global economic health.
█ FEATURES
Requesting a list of currencies
This indicator requests data for every valid currency pair combination from the list of currencies defined by the "Currency list" input in the "Settings/Inputs" tab. The list can contain up to six unique currency codes separated by commas, resulting in a maximum of 30 requested currency pairs.
For example, if the specified "Currency list" input is "CAD, USD, EUR", the indicator requests and displays relevant data for six currency pair combinations: "CADUSD", "USDCAD", "CADEUR", "EURCAD", "USDEUR", "EURUSD". See the "Grid display" section below to understand how the script organizes the requested information.
Each item in the comma-separated list must represent a valid currency code. If the "Currency list" input contains an invalid currency code, the corresponding cells for that currency in the "Cross rates" or "Heat map" grid show "NaN" values. If the list contains empty items, e.g., "CAD, ,EUR, ", the indicator ignores them in its data requests and calculations.
NOTE: Some uncommon currency pair combinations might not have data feeds available. If no available symbols provide the exchange rates between two specified currencies, the corresponding table cells show "NaN" results.
Realtime data
The indicator retrieves realtime market prices, daily price changes, and minimum tick sizes for all the currency pairs derived from the "Currency list" input. It updates the retrieved information shown in its grid display after new ticks become available to reflect the latest known values.
NOTE: Pine scripts execute on realtime bars only when new ticks are available in the chart's data feed. If no new updates are available from the chart's realtime feed, it may cause a delay in the data the indicator receives.
Grid display
This indicator displays the requested data for each currency pair in a table with cells organized as a grid. Each row name corresponds to a pair's base currency , and each column name corresponds to a quote currency . The cell at the intersection of a specific row and column shows the value requested from the corresponding currency pair.
For example, the cell at the intersection of a "EUR" row and "USD" column shows the data retrieved for the "EURUSD" currency pair, and the cell at the "USD" row and "EUR" column shows data for the inverse pair ("USDEUR").
Note that the main diagonal cells in the table, where rows and columns with the same names intersect, are blank. The exchange rate from one currency to itself is always 1, and no Forex symbols such as "EUREUR" exist.
The dropdown input at the top of the "Settings/Inputs" tab determines the type of information displayed in the table. Two options are available: "Cross rates" and "Heat map" . Both modes color their cells for light and dark themes separately based on the inputs in the "Colors" section.
Cross rates
When a user selects the "Cross rates" display mode, the table's cells show the latest available exchange rate for each currency pair, emulating the behavior of the Cross Rates widget. Each cell's value represents the amount of the quote currency (column name) that equals one unit of the base currency (row name). This display allows users to compare cross rates across currency pairs, and their inverses.
The background color of each cell changes based on the most recent update to the exchange rate, allowing users to monitor the direction of short-term fluctuations as they occur. By default, the background turns green (positive cell color) when the cross rate increases from the last recorded update and red (negative cell color) when the rate decreases. The cell's color reverts to the chart's background color after no new updates are available for 200 milliseconds.
Heat map
When a user selects the "Heat map" display mode, the table's cells show the latest daily percentage change of each currency pair, emulating the behavior of the Heat Map widget.
In this mode, the background color of each cell depends on the corresponding currency pair's daily performance. Heat maps typically use colors that vary in intensity based on the calculated values. This indicator uses the following color coding by default:
• Green (Positive cell color): Percentage change > +0.1%
• No color: Percentage change between 0.0% and +0.1%
• Bright red (Negative cell color): Percentage change < -0.1%
• Lighter/darker red (Minor negative cell color): Percentage change between 0.0% and -0.1%
█ FOR Pine Script™ CODERS
• This script utilizes dynamic requests to iteratively fetch information from multiple contexts using a single request.security() instance in the code. Previously, `request.*()` functions were not allowed within the local scopes of loops or conditional structures, and most `request.*()` function parameters, excluding `expression`, required arguments of a simple or weaker qualified type. The new `dynamic_requests` parameter in script declaration statements enables more flexibility in how scripts can use `request.*()` calls. When its value is `true`, all `request.*()` functions can accept series arguments for the parameters that define their requested contexts, and `request.*()` functions can execute within local scopes. See the Dynamic requests section of the Pine Script™ User Manual to learn more.
• Scripts can execute up to 40 unique `request.*()` function calls. A `request.*()` call is unique only if the script does not already call the same function with the same arguments. See this section of the User Manual's Limitations page for more information.
• Typically, when requesting higher-timeframe data with request.security() using barmerge.lookahead_on as the `lookahead` argument, the `expression` argument should use the history-referencing operator to offset the series, preventing lookahead bias on historical bars. However, the request.security() call in this script uses barmerge.lookahead_on without offsetting the `expression` because the script only displays results for the latest historical bar and all realtime bars, where there is no future information to leak into the past. Instead, using this call on those bars ensures each request fetches the most recent data available from each context.
• The request.security() instance in this script includes a `calc_bars_count` argument to specify that each request retrieves only a minimal number of bars from the end of each symbol's historical data feed. The script does not need to request all the historical data for each symbol because it only shows results on the last chart bar that do not depend on the entire time series. In this case, reducing the retrieved bars in each request helps minimize resource usage without impacting the calculated results.
Look first. Then leap.

MACD with DPO Strategy by NGExplanation of the MACD with DPO Strategy:
MACD (Moving Average Convergence Divergence):
The MACD is a trend-following indicator that shows the relationship between two moving averages of a price.
In this script:
We calculate the MACD line by subtracting the slow moving average (typically 26-period EMA) from the fast moving average (typically 12-period EMA).
The Signal line is calculated as a 9-period EMA of the MACD line.
The Histogram is the difference between the MACD line and the Signal line, indicating the momentum of the price trend.
Buy Condition: The script generates a buy signal when the MACD histogram crosses from negative to positive (indicating a bullish momentum) and DPO is also positive.
Sell Condition: The script generates a sell signal when the MACD histogram crosses from positive to negative (indicating a bearish momentum) and DPO is also negative.
DPO (Detrended Price Oscillator):
The DPO removes long-term trends from prices, making it easier to identify shorter-term cycles or oscillations.
In this script:
We calculate the DPO by subtracting a shifted simple moving average (SMA) from the close price. The shifting period depends on half the specified period.
We also calculate the DPO SMA as a 30-period EMA of the DPO values.
DPO Color: The DPO line is colored green when the DPO is above zero (indicating upward momentum) and red when it is below zero (indicating downward momentum). The histogram is also colored based on whether the DPO is positive or negative.
Plotting and Alerts:
The script plots the MACD, Signal, and Histogram on the chart.
Additionally, it plots the DPO and its SMA with different colors depending on whether the DPO is above or below zero.
Buy Signal: A green arrow labeled "BUY" is plotted below the bar when both MACD and DPO indicate a bullish condition.
Sell Signal: A red arrow labeled "SELL" is plotted above the bar when both MACD and DPO indicate a bearish condition.
Background colors are used to highlight the chart whenever a buy or sell condition occurs.
The script also includes alerts for both buy and sell signals, allowing users to set notifications when conditions are met.
How to Use:
Identify Buy and Sell Signals:
The script generates a Buy signal when:
The MACD histogram crosses from negative to positive (bullish momentum), and
The DPO is above zero (indicating upward momentum).
The script generates a Sell signal when:
The MACD histogram crosses from positive to negative (bearish momentum), and
The DPO is below zero (indicating downward momentum).
Chart Visualization:
The MACD histogram and Signal line help visualize the momentum and potential trend reversal.
The DPO and DPO SMA help visualize the shorter-term price cycles.
The signals (Buy and Sell) will be plotted on the chart with arrows indicating entry points.
Customization:
You can adjust the MACD and DPO parameters (such as fast_length, slow_length, period_) to fit your trading style or market conditions.
The script can be used in any timeframe depending on your strategy (e.g., intraday trading or longer-term trading).
Example Scenario:
If you're looking for potential buy opportunities, wait for the script to generate a buy signal (green arrow) where the MACD histogram has shifted to positive, and DPO is also in the green (above zero). This signals that both momentum and cycle direction are aligned for a potential upward movement.
Conversely, for sell opportunities, wait for the red arrow where MACD momentum is turning negative and DPO is also negative (below zero), indicating a bearish condition.
This combination of MACD and DPO allows traders to identify stronger and more reliable entry/exit points by confirming the trend with the MACD and detecting shorter-term price cycles with the DPO.
Ticker Tape█ OVERVIEW
This indicator creates a dynamic, scrolling display of multiple securities' latest prices and daily changes, similar to the ticker tapes on financial news channels and the Ticker Tape Widget . It shows realtime market information for a user-specified list of symbols along the bottom of the main chart pane.
█ CONCEPTS
Ticker tape
Traditionally, a ticker tape was a continuous, narrow strip of paper that displayed stock prices, trade volumes, and other financial and security information. Invented by Edward A. Calahan in 1867, ticker tapes were the earliest method for electronically transmitting live stock market data.
A machine known as a "stock ticker" received stock information via telegraph, printing abbreviated company names, transaction prices, and other information in a linear sequence on the paper as new data came in. The term "ticker" in the name comes from the "tick" sound the machine made as it printed stock information. The printed tape provided a running record of trading activity, allowing market participants to stay informed on recent market conditions without needing to be on the exchange floor.
In modern times, electronic displays have replaced physical ticker tapes. However, the term "ticker" remains persistent in today's financial lexicon. Nowadays, ticker symbols and digital tickers appear on financial news networks, trading platforms, and brokerage/exchange websites, offering live updates on market information. Modern electronic displays, thankfully, do not rely on telegraph updates to operate.
█ FEATURES
Requesting a list of securities
The "Symbol list" text box in the indicator's "Settings/Inputs" tab allows users to list up to 40 symbols or ticker Identifiers. The indicator dynamically requests and displays information for each one. To add symbols to the list, enter their names separated by commas . For example: "BITSTAMP:BTCUSD, TSLA, MSFT".
Each item in the comma-separated list must represent a valid symbol or ticker ID. If the list includes an invalid symbol, the script will raise a runtime error.
To specify a broker/exchange for a symbol, include its name as a prefix with a colon in the "EXCHANGE:SYMBOL" format. If a symbol in the list does not specify an exchange prefix, the indicator selects the most commonly used exchange when requesting the data.
Realtime updates
This indicator requests symbol descriptions, current market prices, daily price changes, and daily change percentages for each ticker from the user-specified list of symbols or ticker identifiers. It receives updated information for each security after new realtime ticks on the current chart.
After a new realtime price update, the indicator updates the values shown in the tape display and their colors.
The color of the percentages in the tape depends on the change in price from the previous day . The text is green when the daily change is positive, red when the value is negative, and gray when the value is 0.
The color of each displayed price depends on the change in value from the last recorded update, not the change over a daily period. For example, if a security's price increases in the latest update, the ticker tape shows that price with green text, even if the current price is below the previous day's closing price. This behavior allows users to monitor realtime directional changes in the requested securities.
NOTE: Pine scripts execute on realtime bars when new ticks are available in the chart's data feed. If no new updates are available from the chart's realtime feed, it may cause a delay in the data the indicator receives.
Ticker motion
This indicator's tape display shows a list of security information that incrementally scrolls horizontally from right to left after new chart updates, providing a dynamic visual stream of current market data. The scrolling effect works by using a counter that increments across successive intervals after realtime ticks to control the offset of each listed security. Users can set the initial scroll offset with the "Offset" input in the "Settings/Inputs" tab.
The scrolling rate of the ticker tape display depends on the realtime ticks available from the chart's data feed. Using the indicator on a chart with frequent realtime updates results in smoother scrolling. If no new realtime ticks are available in the chart's feed, the ticker tape does not move. Users can also deactivate the scrolling feature by toggling the "Running" input in the indicator's settings.
█ FOR Pine Script™ CODERS
• This script utilizes dynamic requests to iteratively fetch information from multiple contexts using a single request.security() instance in the code. Previously, `request.*()` functions were not allowed within the local scopes of loops or conditional structures, and most `request.*()` function parameters, excluding `expression`, required arguments of a simple or weaker qualified type. The new `dynamic_requests` parameter in script declaration statements enables more flexibility in how scripts can use `request.*()` calls. When its value is `true`, all `request.*()` functions can accept series arguments for the parameters that define their requested contexts, and `request.*()` functions can execute within local scopes. See the Dynamic requests section of the Pine Script™ User Manual to learn more.
• Scripts can execute up to 40 unique `request.*()` function calls. A `request.*()` call is unique only if the script does not already call the same function with the same arguments. See this section of the User Manual's Limitations page for more information.
• This script converts a comma-separated "string" list of symbols or ticker IDs into an array . It then loops through this array, dynamically requesting data from each symbol's context and storing the results within a collection of custom `Tape` objects . Each `Tape` instance holds information about a symbol, which the script uses to populate the table that displays the ticker tape.
• This script uses the varip keyword to declare variables and `Tape` fields that update across ticks on unconfirmed bars without rolling back. This behavior allows the script to color the tape's text based on the latest price movements and change the locations of the table cells after realtime updates without reverting. See the `varip` section of the User Manual to learn more about using this keyword.
• Typically, when requesting higher-timeframe data with request.security() using barmerge.lookahead_on as the `lookahead` argument, the `expression` argument should use the history-referencing operator to offset the series, preventing lookahead bias on historical bars. However, the request.security() call in this script uses barmerge.lookahead_on without offsetting the `expression` because the script only displays results for the latest historical bar and all realtime bars, where there is no future information to leak into the past. Instead, using this call on those bars ensures each request fetches the most recent data available from each context.
• The request.security() instance in this script includes a `calc_bars_count` argument to specify that each request retrieves only a minimal number of bars from the end of each symbol's historical data feed. The script does not need to request all the historical data for each symbol because it only shows results on the last chart bar that do not depend on the entire time series. In this case, reducing the retrieved bars in each request helps minimize resource usage without impacting the calculated results.
Look first. Then leap.

Risk Management Calculator with Fees and Take Profit [CHE]Risk Management Calculator with Fees and Take Profit
Welcome to the Risk Management Calculator with Fees and Take Profit script! This powerful tool is designed to help traders manage their risk effectively, calculate leverage, and set take profit targets. The script is inspired by and builds upon the ideas from the following TradingView script: ().
This script is inspired by and builds upon the ideas from the following TradingView script:
Features
1. Portfolio Size Input: Enter the size of your portfolio to accurately calculate your risk and leverage.
2. Max Loss Percent Input: Specify the maximum percentage of your portfolio that you are willing to risk on a single trade.
3. Max Leverage Input: Set the maximum leverage you are comfortable using.
4. Trading Fee Input: Include trading fees in your calculations to get a more realistic view of your potential losses and gains.
5. ATR Settings: Configure the ATR period and multiplier to calculate your stop loss and take profit levels.
6. RSI Settings: Adjust the RSI period for trend analysis.
How to Use
Portfolio Size
- Description: This is the total value of your trading account.
- Input: `portfolioSize`
- Default Value: 100
- Minimum Value: 0.001
Max Loss Percent
- Description: The maximum percentage of your portfolio you are willing to lose on a single trade.
- Input: `maxLossPercent`
- Default Value: 3%
- Range: 0.1% to 100%
Max Leverage
- Description: The maximum leverage you wish to use.
- Input: `maxLeverage`
- Default Value: 125
- Range: 1 to 125
Trading Fee
- Description: The fee percentage you pay per trade.
- Input: `feeRate`
- Default Value: 1%
- Range: 0% to 10%
ATR Settings
- ATR Period: Number of bars used to calculate the Average True Range.
- Input: `atrPeriod`
- Default Value: 5
- ATR Multiplier: Multiplier for ATR to set stop loss levels.
- Input: `atrMultiplier`
- Default Value: 2.0
Take Profit Multiplier
- Description: Multiplier for ATR to set take profit levels.
- Input: `takeProfitMultiplier`
- Default Value: 2.0
RSI Settings
- RSI Period: Period for the RSI calculation.
- Input: `rsiPeriod`
- Default Value: 14
Dashboard
The script includes a customizable dashboard that displays the following information:
- Portfolio Size
- Maximum Loss Amount
- Entry Price
- Stop Loss Price
- Stop Loss Percentage
- Calculated Leverage
- Order Value
- Order Quantity
- Trend Direction
- Adjusted Maximum Loss Percentage
- Take Profit Price
Dashboard Settings
- Location: Choose the position of the dashboard on the chart.
- Options: 'Top Right', 'Bottom Right', 'Top Left', 'Bottom Left'
- Size: Adjust the size of the dashboard text.
- Options: 'Tiny', 'Small', 'Normal', 'Large'
- Text/Frame Color: Set the color for the text and frame of the dashboard.
Underlying Principles and Assumptions
Leverage Calculation
The leverage calculation is fundamental to risk management in trading. It ensures that the risk per trade does not exceed a specified percentage of the portfolio. This calculation takes into account the potential loss from the entry price to the stop loss level, adjusted for trading fees. By dividing the maximum acceptable loss by the total potential loss (including fees), we derive a leverage that limits the exposure per trade. This approach helps traders avoid over-leveraging, which can lead to significant losses.
ATR and Stop Loss
The Average True Range (ATR) is used to set stop loss levels because it measures market volatility. A higher ATR indicates more volatility, which means wider stop losses are needed to avoid being prematurely stopped out by normal market fluctuations. By using an ATR multiplier, the stop loss is dynamically adjusted based on current market conditions, providing a more robust risk management strategy.
Take Profit Calculation
The take profit level is calculated as a multiple of the ATR, ensuring that it is set at a realistic level relative to market volatility. This method aims to capture significant price movements while avoiding the noise of smaller fluctuations. Setting take profit targets this way helps in locking in profits when the market moves favorably.
RSI for Trend Confirmation
The Relative Strength Index (RSI) is used to confirm the trend direction. An RSI above 50 typically indicates a bullish trend, while an RSI below 50 indicates a bearish trend. By aligning trades with the prevailing trend, the script increases the probability of successful trades. This trend confirmation helps in making informed decisions about leverage and position sizing.
Risk Color Coding
The script uses color coding to visually indicate the risk level and trend direction. Green indicates a favorable condition for long trades, red for short trades, and gray for neutral conditions. This intuitive color coding aids in quickly assessing the market conditions and making timely trading decisions.
Conclusion
This script aims to provide a comprehensive risk management tool for traders. By integrating portfolio size, leverage, fees, ATR, and RSI, it helps in making informed trading decisions. We hope you find this tool useful in your trading journey.
Happy Trading!

Daniels Script v2 EMA 4h y DTitle:
"EMA 200 Dynamic Projection on 4H and Daily Charts"
Description:
"This script is designed to provide traders with a comprehensive view of market trends by displaying the 200-period Exponential Moving Average (EMA) on both 4-hour and daily charts simultaneously. Unlike typical EMA representations, this script enhances user decision-making by projecting the potential future path of these EMAs using a dynamic slope calculation.
The dynamic projection feature calculates the slope based on recent changes in the EMA, allowing traders to visualize potential future trends more accurately. This innovative approach helps in identifying potential areas of support and resistance before they are fully formed, offering traders a strategic advantage in planning their entries and exits.
Key Features:
Dual Time Frame Analysis: View 200-period EMAs for both 4-hour and daily charts on a single graph.
Dynamic EMA Projections: Projected using a calculated slope from recent EMA changes, presented as dotted lines for clear distinction.
Enhanced Trend Visualization: Helps in recognizing trend continuations or reversals early, aiding in risk management and decision-making processes.
Usage:
Simply add the script to your chart, and the EMAs along with their projections will automatically be displayed. The 4-hour EMA is shown in green, while the daily EMA is in red. Projections extend from the last known data point, providing a visual guide to potential future movements.
This script is unique in its approach to combining real-time EMA analysis with predictive modeling, making it a valuable tool for traders looking to enhance their technical analysis capabilities."
## SPANISH
Título del Script:
"Proyección Dinámica de la EMA 200 en Gráficos de 4H y Diarios"
Descripción del Script:
"Este script está diseñado para proporcionar a los traders una visión integral de las tendencias del mercado al mostrar la Media Móvil Exponencial (EMA) de 200 periodos tanto en los gráficos de 4 horas como diarios simultáneamente. A diferencia de las representaciones típicas de la EMA, este script mejora la toma de decisiones del usuario al proyectar el posible camino futuro de estas EMAs utilizando un cálculo de pendiente dinámico.
La función de proyección dinámica calcula la pendiente basada en cambios recientes en la EMA, permitiendo a los traders visualizar tendencias futuras potenciales con mayor precisión. Este enfoque innovador ayuda a identificar áreas potenciales de soporte y resistencia antes de que se formen completamente, ofreciendo a los traders una ventaja estratégica en la planificación de sus entradas y salidas.
Características Clave:
Análisis de Doble Marco Temporal: Visualiza las EMAs de 200 periodos para los gráficos de 4 horas y diarios en un solo gráfico.
Proyecciones Dinámicas de la EMA: Proyectadas utilizando una pendiente calculada a partir de cambios recientes en la EMA, presentadas como líneas punteadas para una clara distinción.
Visualización Mejorada de Tendencias: Ayuda en el reconocimiento temprano de continuaciones o reversos de tendencias, asistiendo en la gestión de riesgos y en los procesos de toma de decisiones.
Uso:
Simplemente añade el script a tu gráfico, y las EMAs junto con sus proyecciones se mostrarán automáticamente. La EMA de 4 horas se muestra en verde, mientras que la EMA diaria está en rojo. Las proyecciones se extienden desde el último punto de datos conocido, proporcionando una guía visual hacia movimientos futuros potenciales.
Este script es único en su enfoque de combinar análisis de EMA en tiempo real con modelado predictivo, convirtiéndolo en una herramienta valiosa para traders que buscan mejorar sus capacidades de análisis técnico."

Triple MA HTF strategy - Dynamic SmoothingThe triple MA strategy is a simple but effective method to trade the trend. The advantage of this script over the existing triple MA strategies is that the user can open a lower time frame chart and select higher time frame inputs for different MA types mainting the visibility on the chart. The dynamic smoothing code makes sure the HTF trendlines are not jagged, but a fluid line visiable on the lower time frame chart. The script comes with a MA crossover and crossunder strategy explained below.
Moving Averages (MA) Crossover for Entry:
Long Entry: A long entry signal is triggered when the moving average line 1 crosses above the moving average line 2. This crossover indicates a potential shift in market sentiment towards the upside. However, to validate this signal, the strategy checks if the moving average 3 on a higher time frame (eg. 4 hour) is in an upward trend. This additional filter ensures that the trade aligns with the prevailing trend on a broader time scale, increasing the probability of success.
Short Entry: Conversely, a short entry signal occurs when the moving average line 1 crosses below the moving average line 2. This crossover suggests a possible downturn in market momentum. However, for a short trade to be confirmed, the strategy verifies that the moving average 3 on the higher time frame is in a downward trend. This confirmation ensures that the trade is in harmony with the overarching market direction.
Exit from Long Position: The strategy triggers an exit signal from a long position when the moving average line 1 crosses below the moving average line 2. This crossover indicates a potential reversal in the market trend, prompting the trader to close their long position and take profits or minimize losses.
Exit from Short Position: Similarly, an exit signal from a short position occurs when the moving average line 1 crosses above the moving average line 2. This crossover suggests a potential shift in market sentiment towards the upside, prompting the trader to exit their short position and manage their risk accordingly.
Features of the script
This Triple MA Strategy is basically the HTF Trend Filter displayed 3 times on the chart. For more infomation on how the MA with dynamic smoothing is calculated I recommend reading the following script:
For risk management I included a simple script to opt for % of eauity or # of contracts of in the instrument. For explanation on how the risk management settings work I refer to my ealier published script:
The strategy is a simplified example for setting up an entry and exit logic based on multiple moving avarages. Hence the script is meant for educational purposes only.

Ichimoku Slope Filtered Signals [UAlgo]
🔶Description:
The "Ichimoku Slope Filtered Signals" indicator is designed to provide trading signals based on the Ichimoku Cloud indicator while incorporating a slope filter. The Ichimoku Cloud is a comprehensive indicator that defines support and resistance, identifies trend direction, and provides trading signals. This script enhances the traditional Ichimoku Cloud signals by incorporating a slope filter, which helps to confirm the strength and direction of the trend.
🔶Key Features:
Ichimoku Cloud Parameters: Users can customize parameters such as Tenkan, Kijun, and Senkou Span lengths, along with multipliers, to adjust the sensitivity of the Ichimoku Cloud.
Slope Filter Settings: Users can specify the number of bars to measure the slope and the lookback period for trend measurement. Additionally, there are options to filter Ichimoku signals based on slope thresholds.
Normalized Slope: The indicator calculates the normalized slope of the selected data series (in this case, Tenkan-sen) and plots it alongside the Ichimoku Cloud.
Signal Generation: Trading signals are generated based on crossovers and crossunders of the Tenkan-sen and Kijun-sen lines of the Ichimoku Cloud. These signals can be further filtered based on the normalized slope of the selected data series.
🔶 Usage:
Customization: Traders can customize the parameters of the Ichimoku Cloud and slope filter according to their trading strategy and risk tolerance.
Interpretation of Signals:
Crossover: A buy signal is generated when the Tenkan-sen line crosses above the Kijun-sen line. This signal can be further filtered based on the normalized slope.
Crossunder: A sell signal is generated when the Tenkan-sen line crosses below the Kijun-sen line. Similar to the buy signal, this can also be filtered based on the normalized slope.
Trend Confirmation: The normalized slope provides additional confirmation of the strength and direction of the trend. A positive slope indicates an upward trend, while a negative slope indicates a downward trend.
Example:
Disclaimer:
Not Financial Advice: This script is provided for educational purposes only and should not be considered financial advice. Traders should conduct their own research and/or consult with a qualified financial advisor before making any investment decisions based on this script.
Risk of Loss: Trading in financial markets involves risk of loss, and past performance is not indicative of future results. Users of this script should be aware of the risks involved in trading and should only trade with capital they can afford to lose.
No Guarantees: There is no guarantee of success or profitability when using this script. Market conditions can change rapidly, and trading results may vary.
Use at Own Risk: The author of this script (UAlgo) does not assume any responsibility for losses incurred as a result of using this script. Traders use this script at their own risk and discretion.
Terms of Use: This script is subject to the terms of the Mozilla Public License 2.0. Users are encouraged to review the license terms before using or distributing the script.
